Examples
Getting Started
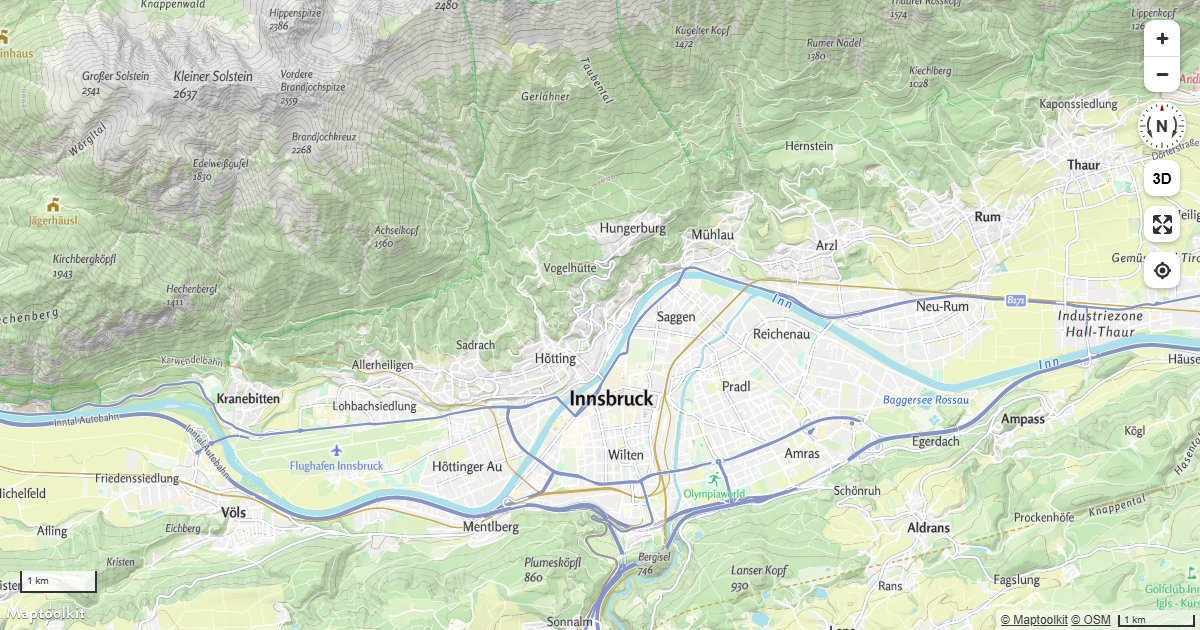
Display Map Navigation Controls
Add zoom, compass, scale, fullscreen, and geolocation controls to a Maptoolkit map using built-in control classes.
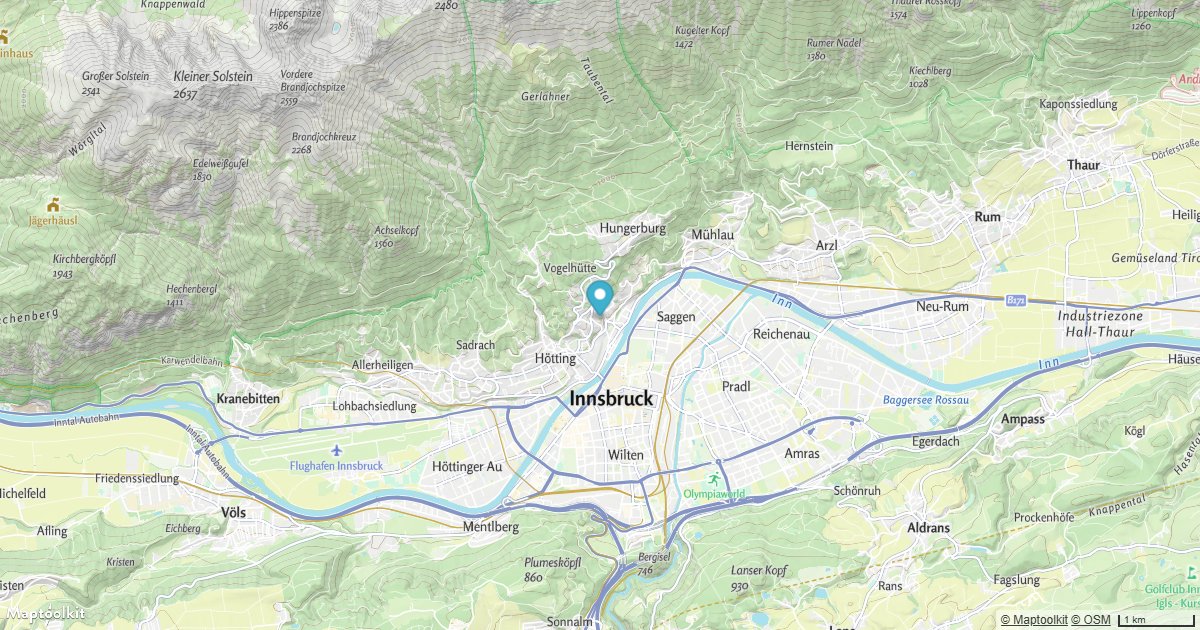
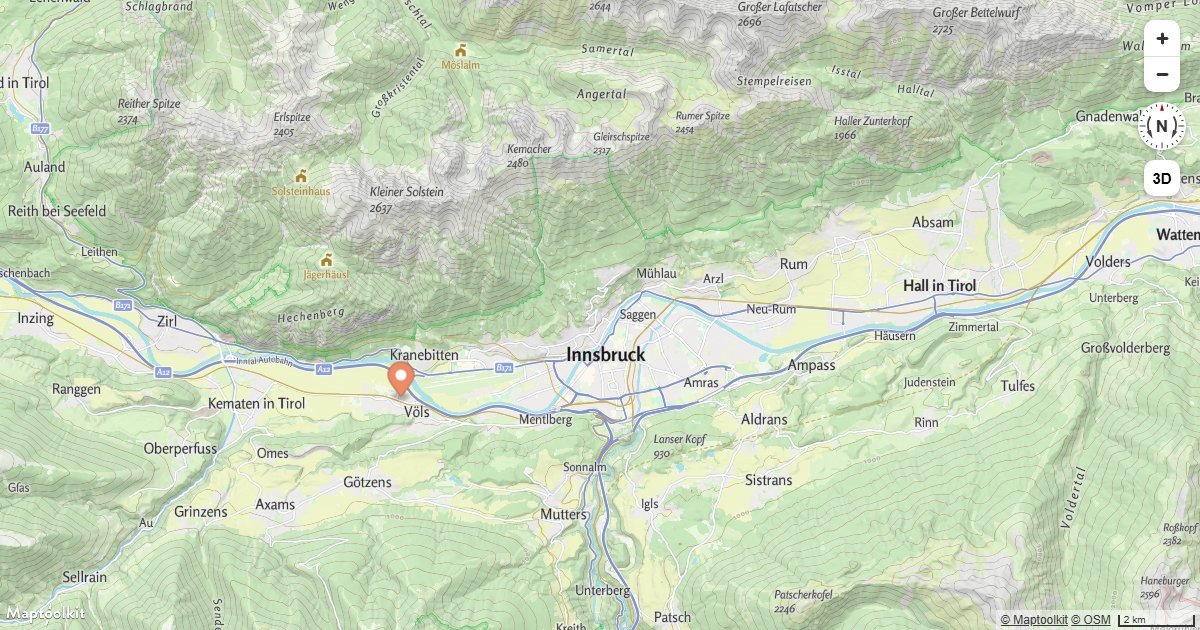
Add a Default Marker
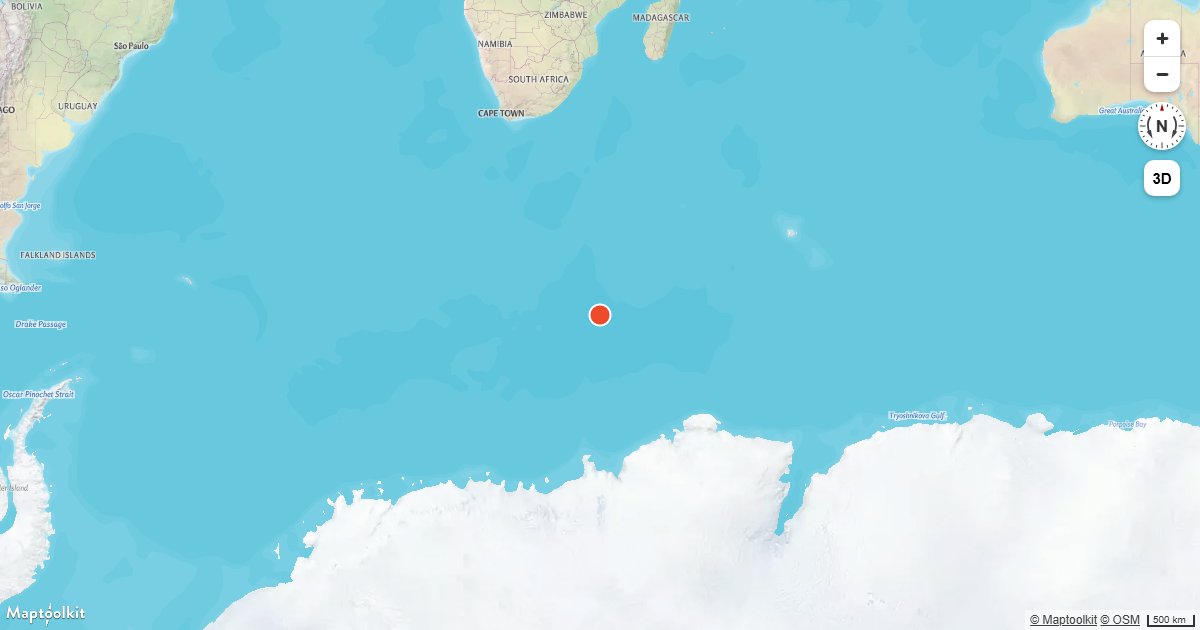
Place a default Maptoolkit Marker at a fixed coordinate on an interactive map.
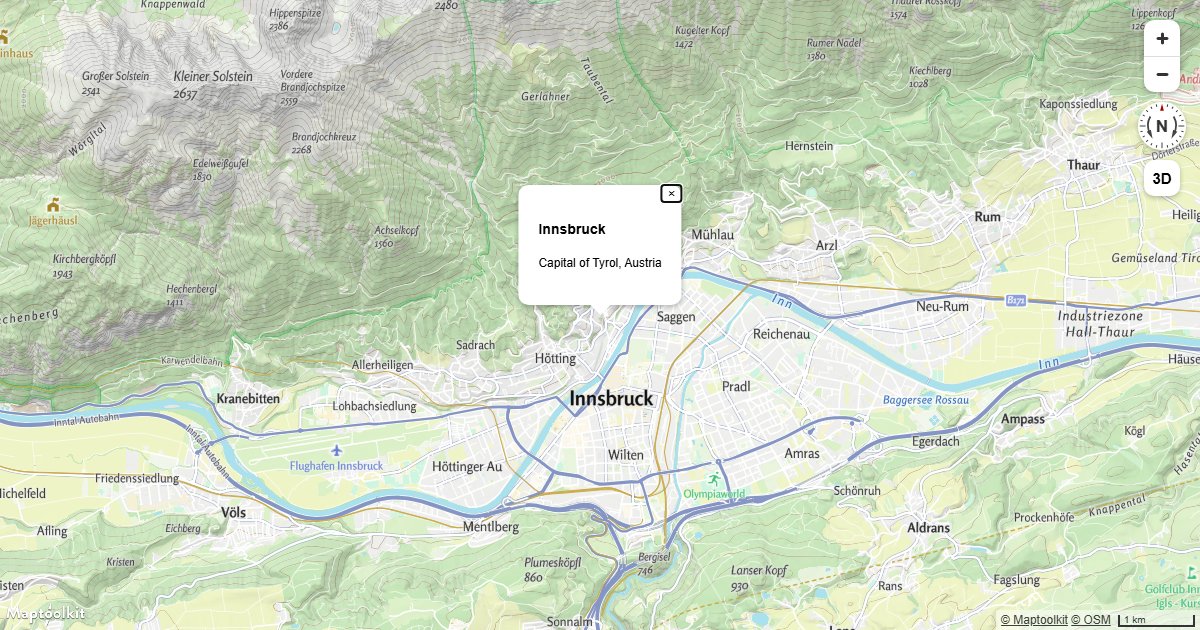
Display a Popup
Show a Maptoolkit Popup with custom HTML content at a fixed geographic coordinate.
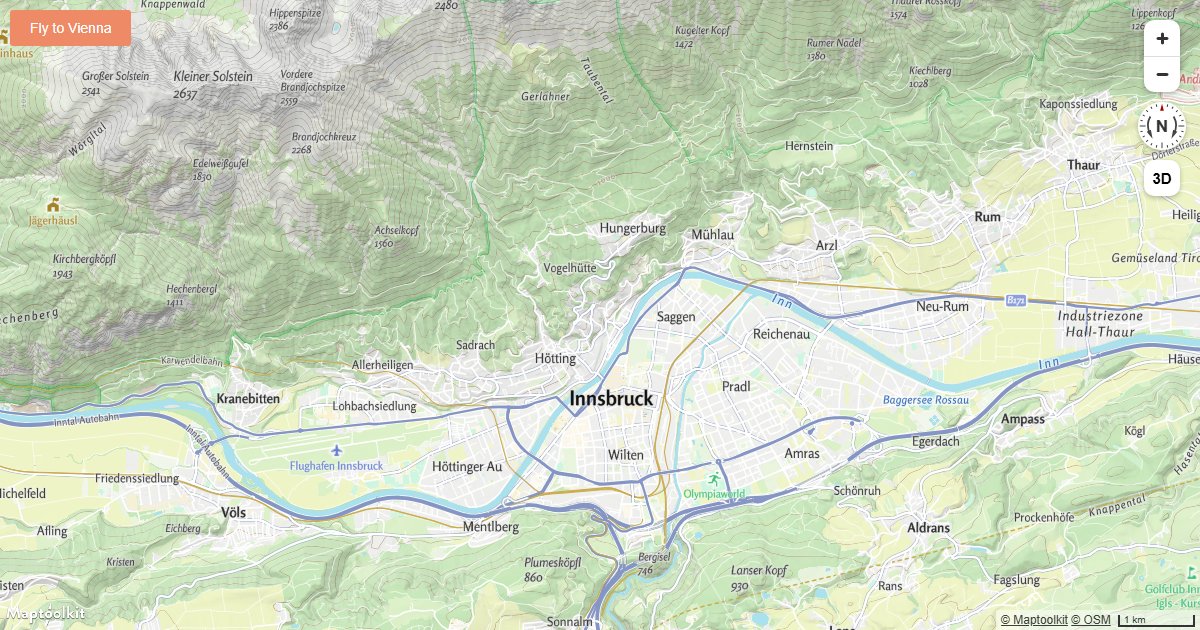
Fly to a Location
Animate the Maptoolkit map camera to a new location with a smooth arc-based fly-to transition.
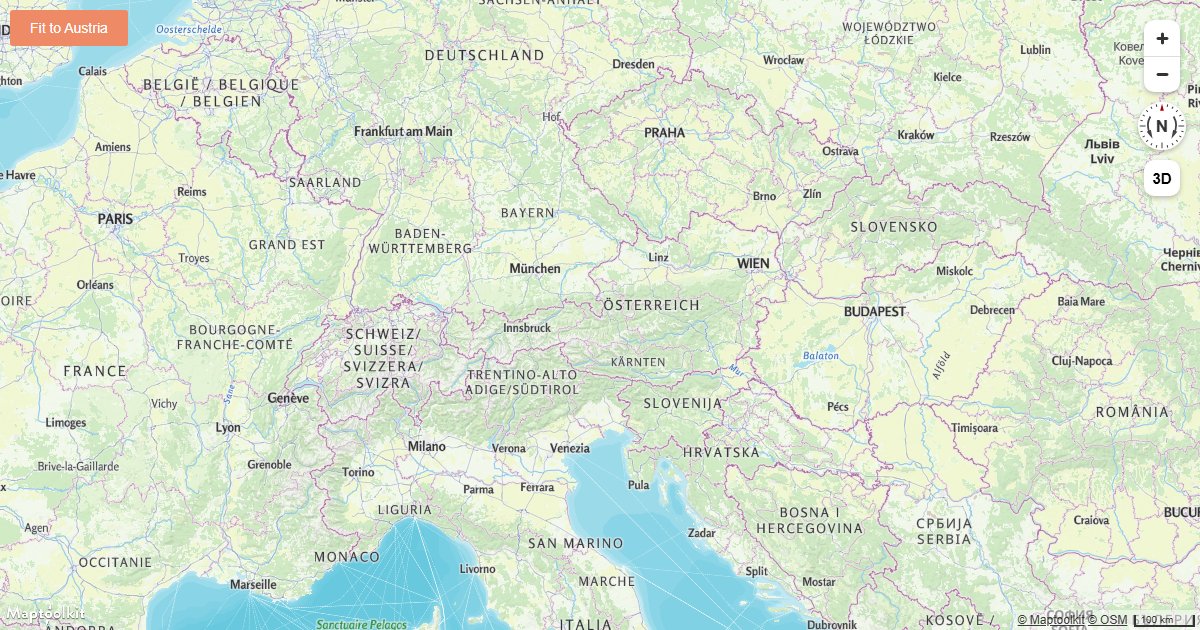
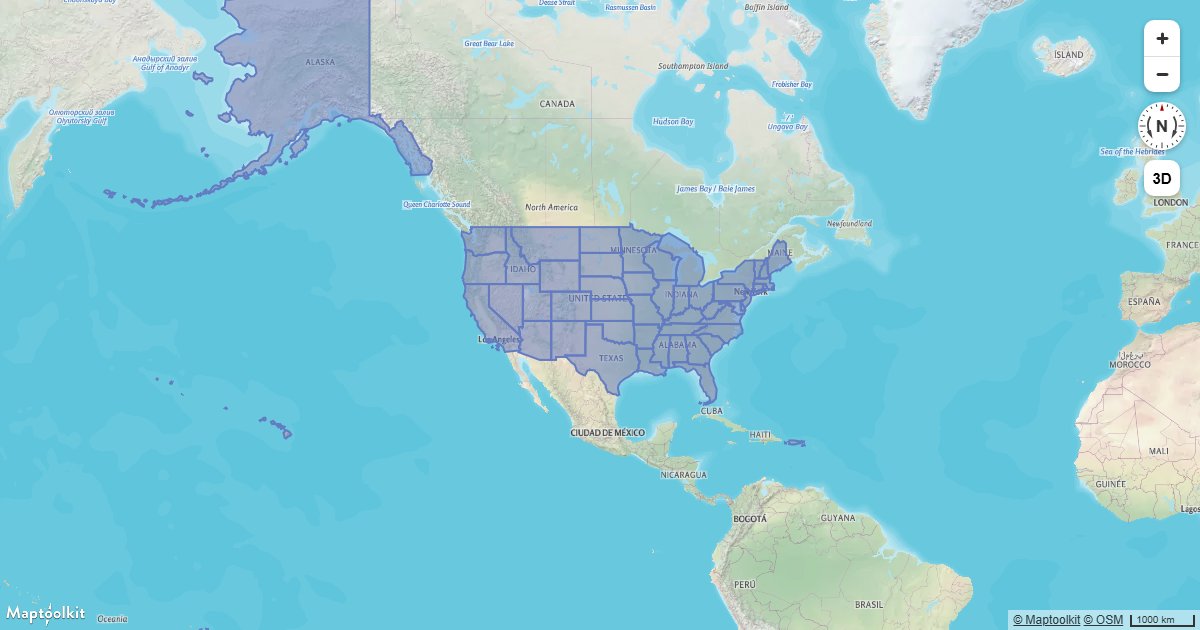
Fit a Map to a Bounding Box
Fit a Maptoolkit map view to a geographic bounding box using fitBounds with optional padding.
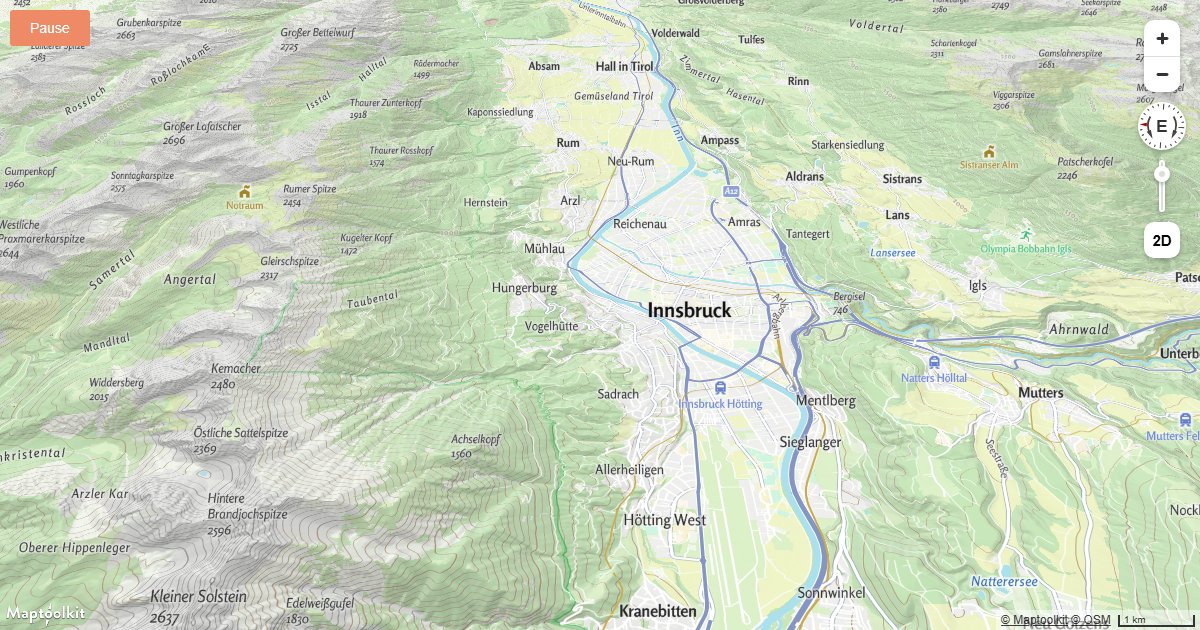
Pitch and Bearing
Initialize a Maptoolkit map with a custom pitch and bearing to set a tilted or rotated starting view.
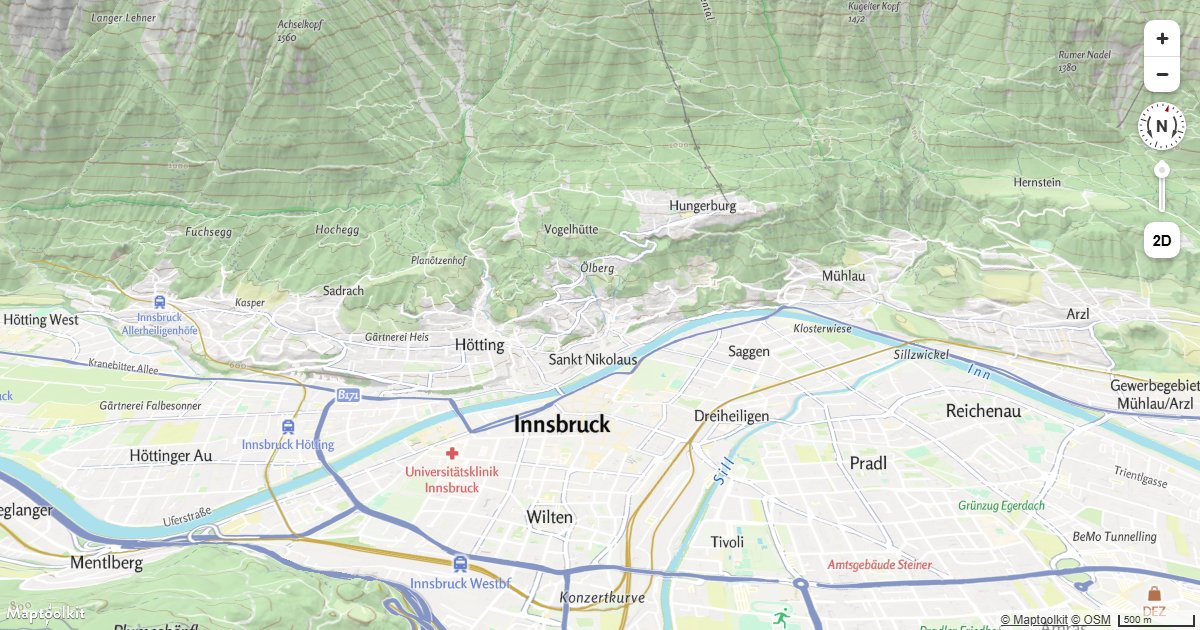
3D Terrain
Render real 3D terrain elevation on a Maptoolkit map using a raster-dem source and terrain exaggeration.
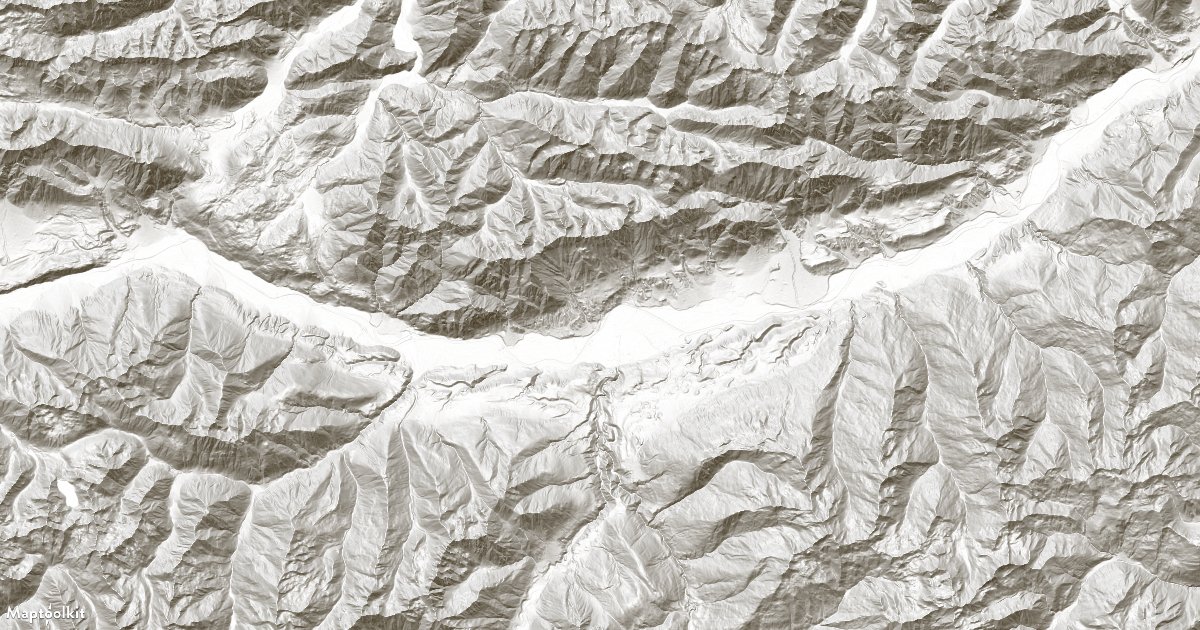
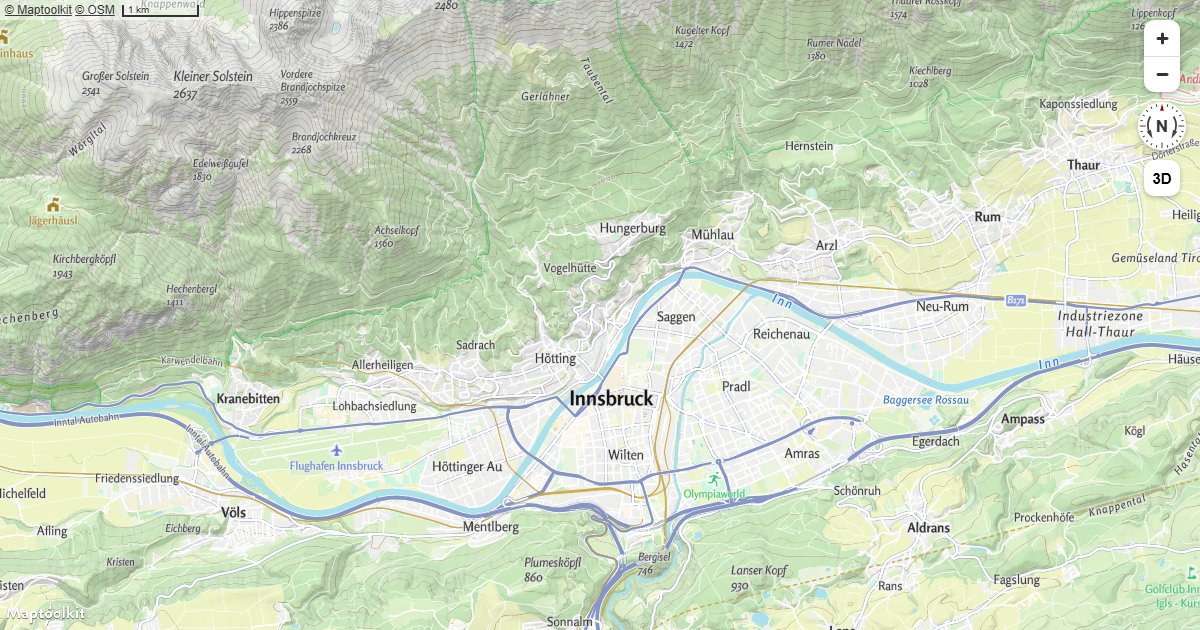
Add a Hillshade Layer
Add a hillshade layer to a Maptoolkit map to show terrain relief using shaded elevation data.
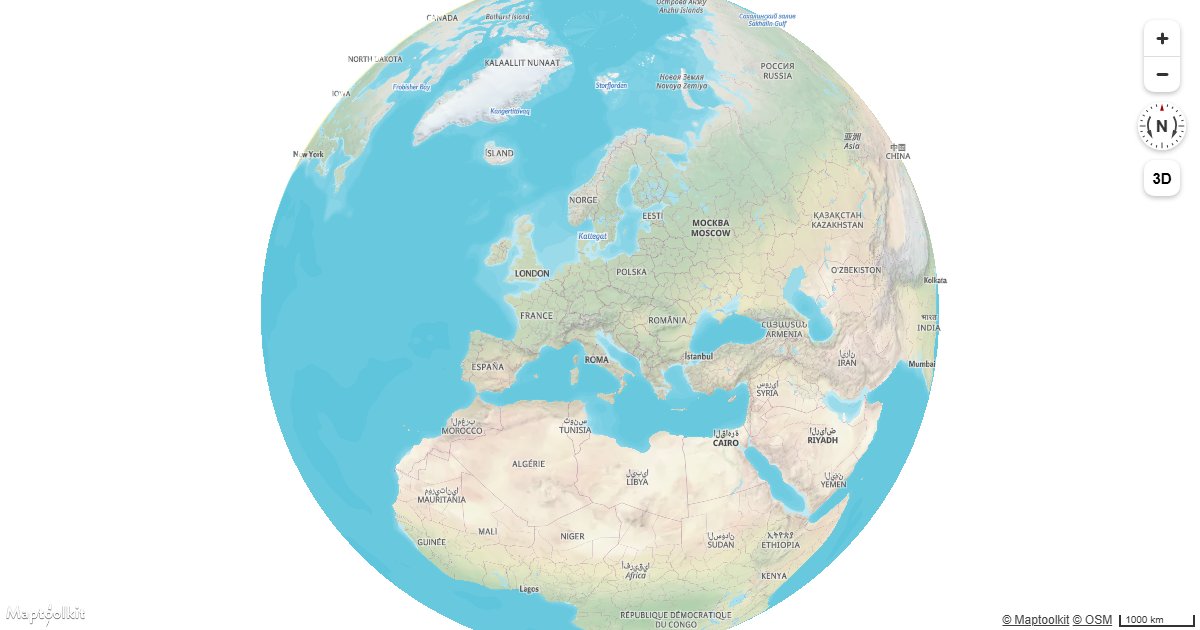
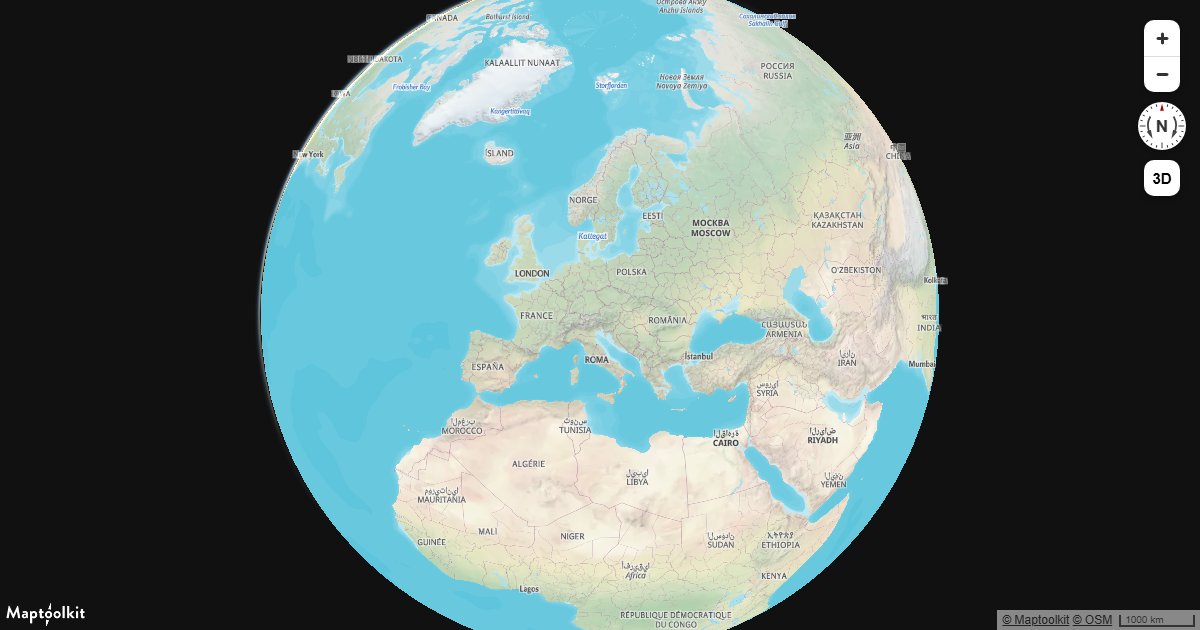
Display a Globe with a Vector Map
Render a Maptoolkit vector map as a 3D globe using the globe projection setting.
Markers & Popups
Add a Default Marker
Place a default Maptoolkit Marker at a fixed coordinate on an interactive map.
Display a Popup
Show a Maptoolkit Popup with custom HTML content at a fixed geographic coordinate.

Attach a Popup to a Marker Instance
Attach a Maptoolkit Popup directly to a Marker so it opens and closes when the marker is clicked.

Create a Draggable Marker
Create a Maptoolkit Marker that the user can drag to any location, with live coordinate feedback.

Display a Popup on Click
Show a Maptoolkit Popup with the clicked coordinates whenever a user clicks anywhere on the map.

Display a Popup on Hover
Show a Maptoolkit Popup with feature properties when the user hovers over a point on the map.
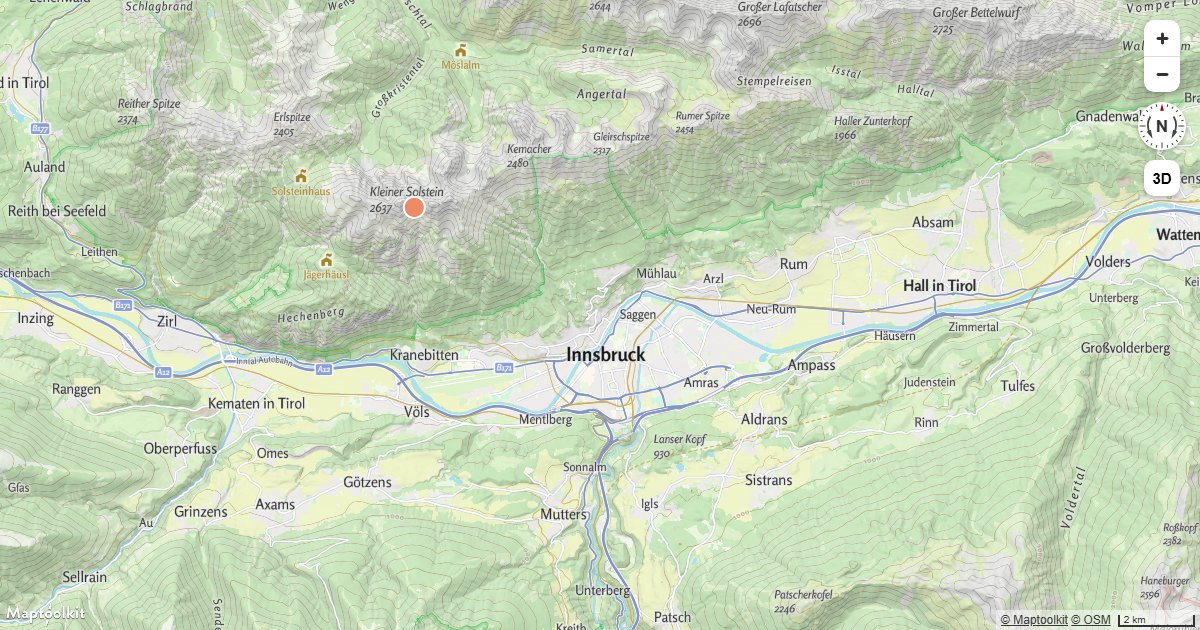
Add an Icon to the Map
Load a custom icon image into the map sprite and render it as a symbol layer on a Maptoolkit map.
Add an Animated Icon to the Map
Create a pulsing animated icon on a Maptoolkit map using a custom image drawn with the Canvas 2D API.
Animate a Marker
Smoothly animate a Maptoolkit Marker along a path by updating its position on each animation frame.
3D & Terrain
3D Terrain
Render real 3D terrain elevation on a Maptoolkit map using a raster-dem source and terrain exaggeration.
Add a Hillshade Layer
Add a hillshade layer to a Maptoolkit map to show terrain relief using shaded elevation data.
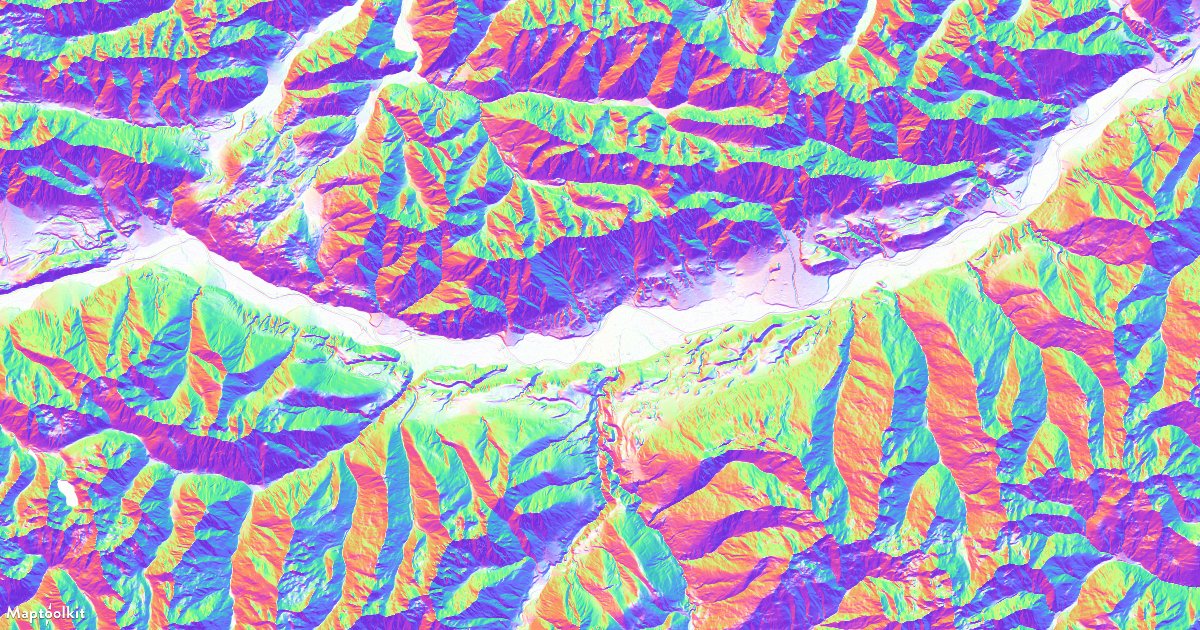
Add a Multidirectional Hillshade Layer
Render a multidirectional hillshade layer on a Maptoolkit map to reveal terrain detail from all directions.
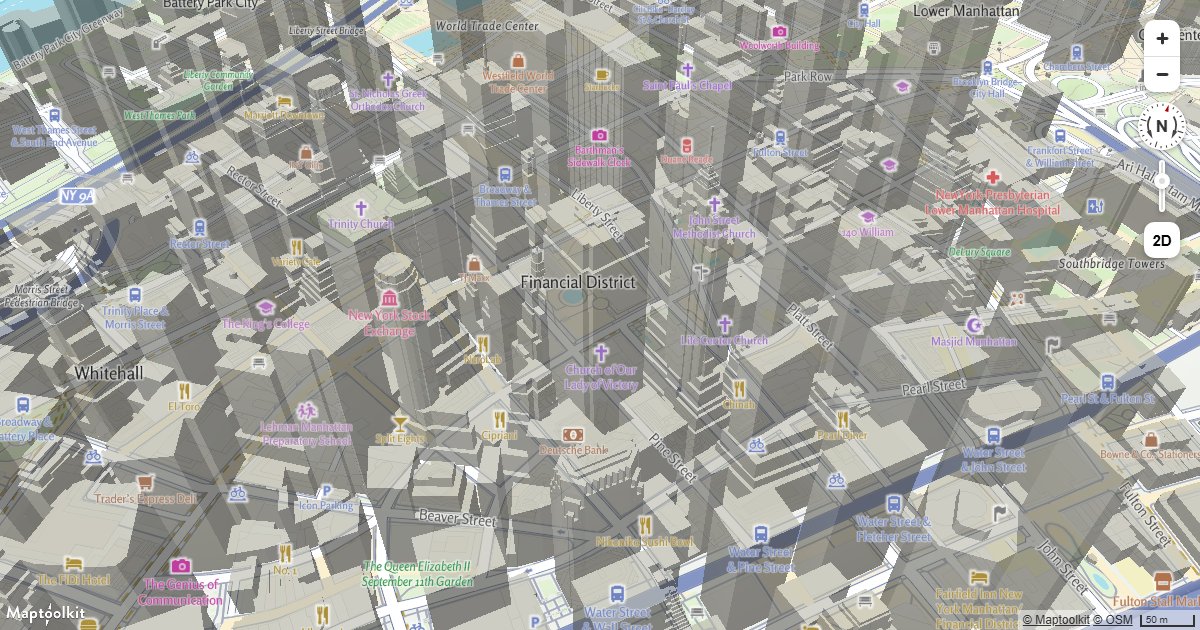
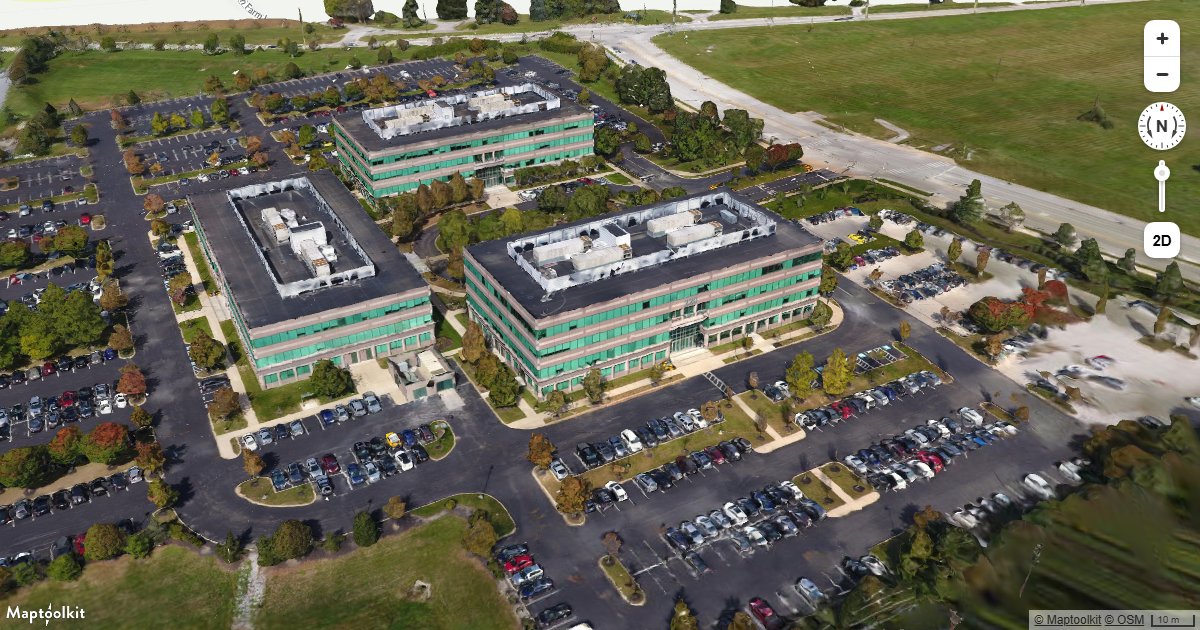
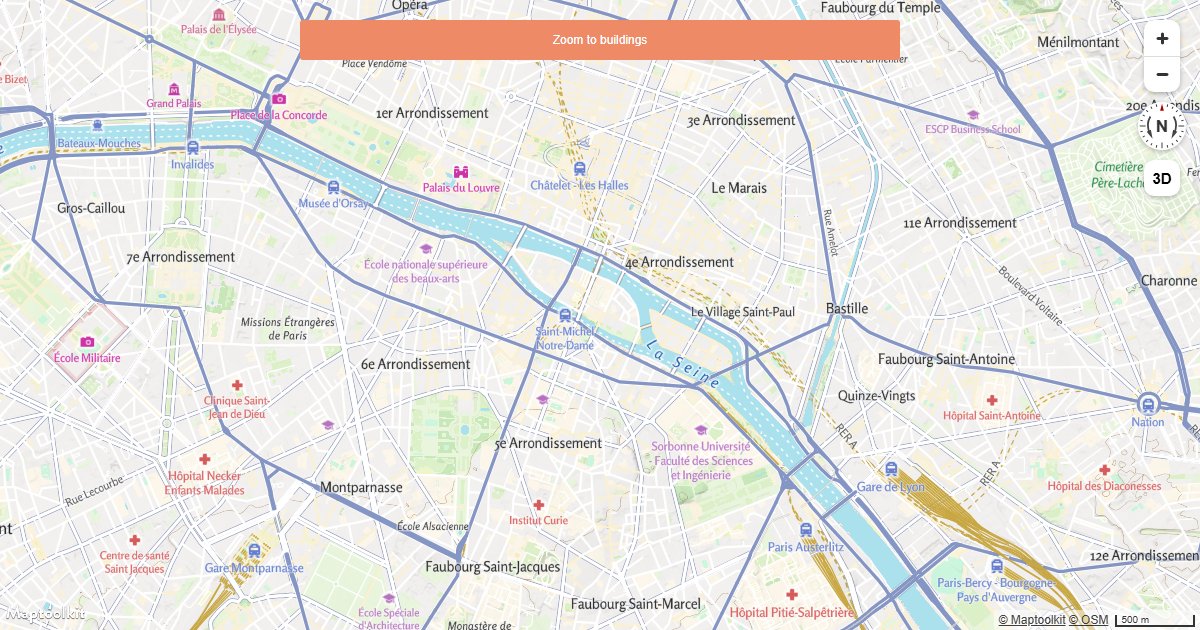
Display Buildings in 3D
Extrude building footprints into 3D on a Maptoolkit map using fill-extrusion layers and height data.
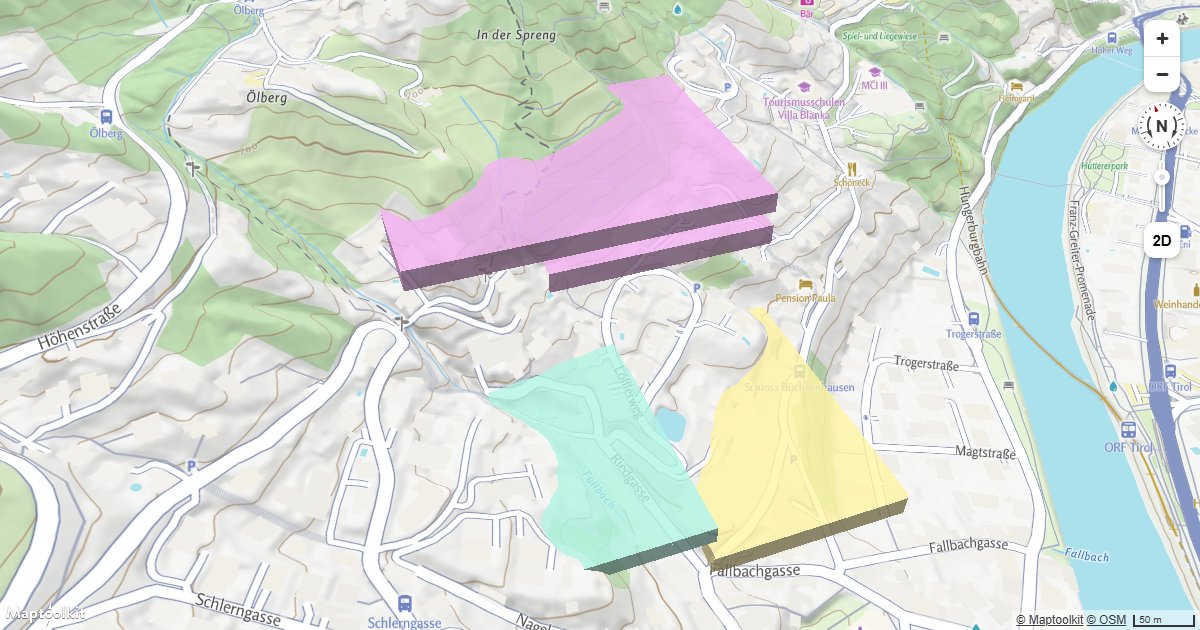
Extrude Polygons for 3D Indoor Mapping
Create a 3D indoor floor plan on a Maptoolkit map by extruding GeoJSON room polygons with fill-extrusion layers.

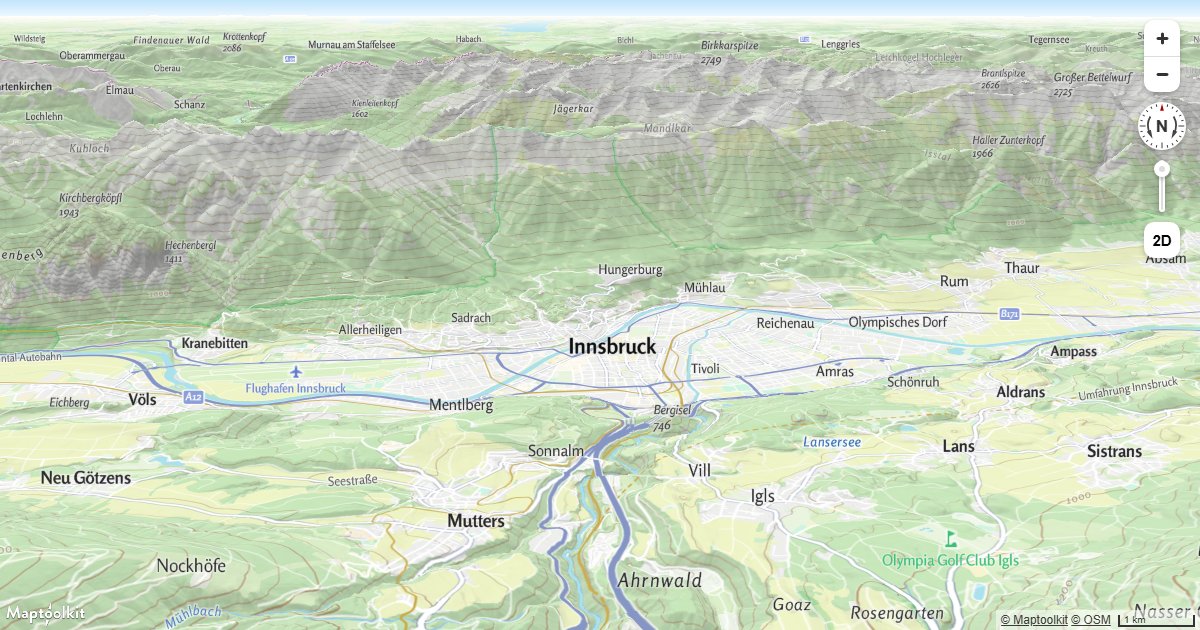
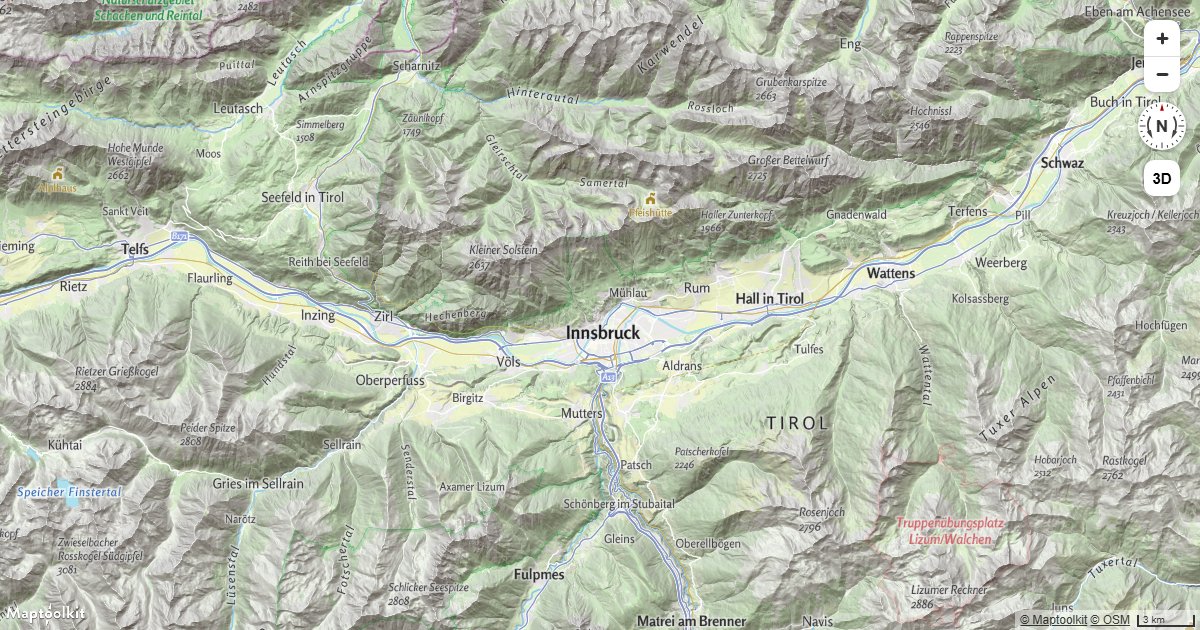
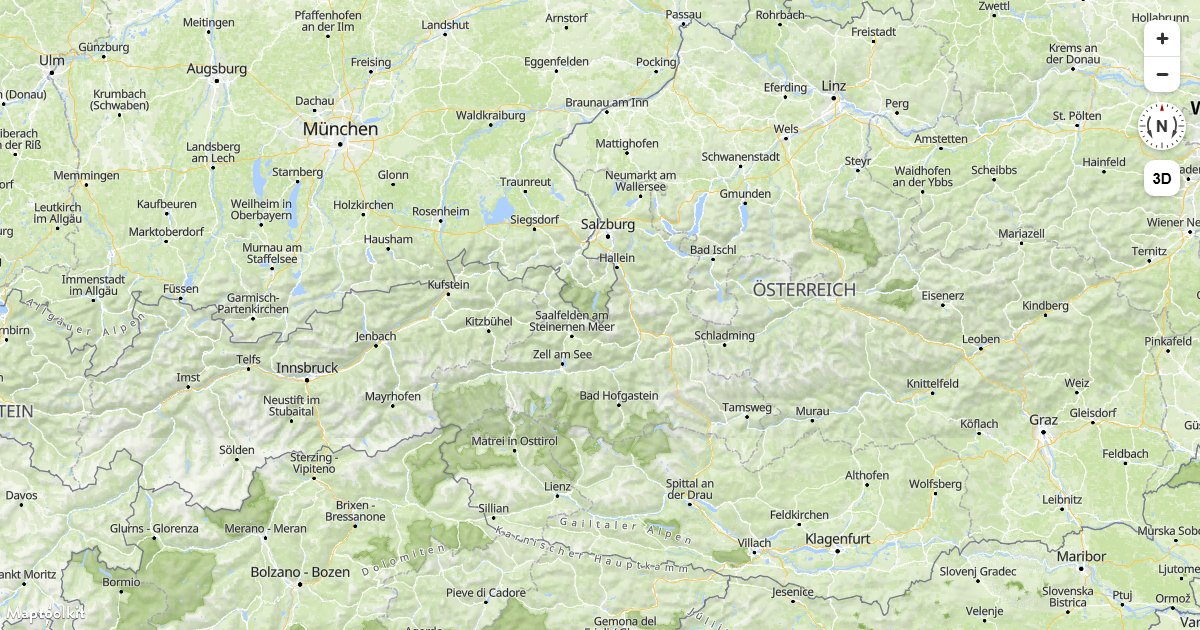
Display a Hybrid Satellite Map with Terrain Elevation
Combine Maptoolkit raster satellite tiles with 3D terrain elevation for a photorealistic mountain map view.
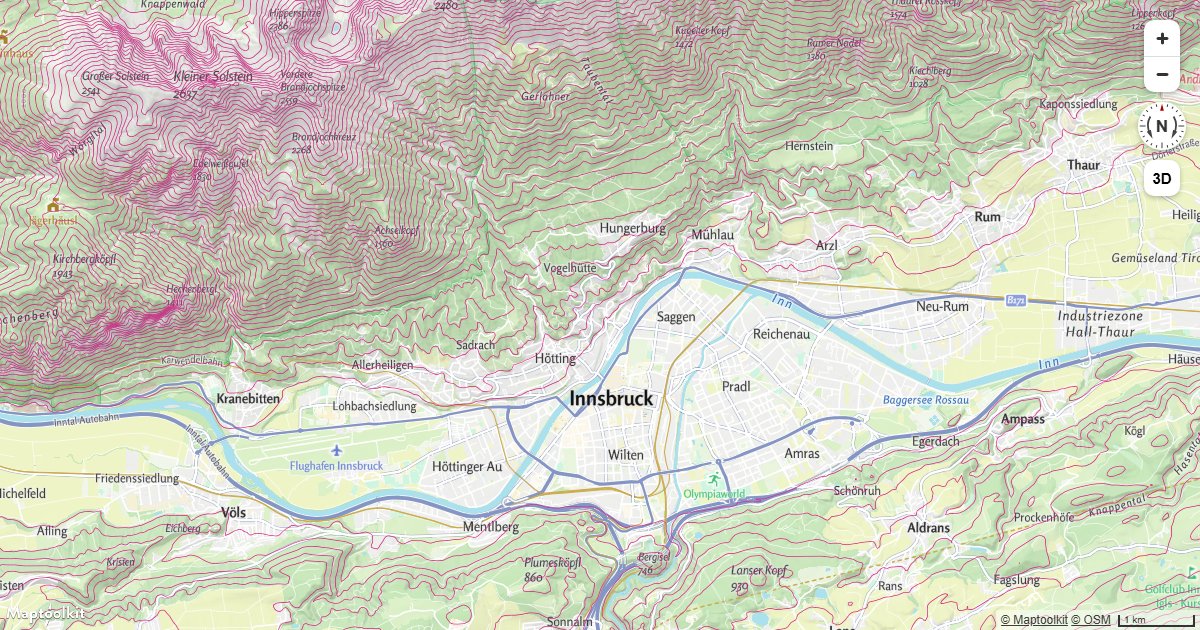
Add Contour Lines
Display elevation contour lines on a Maptoolkit map using a raster-dem source and a line layer.
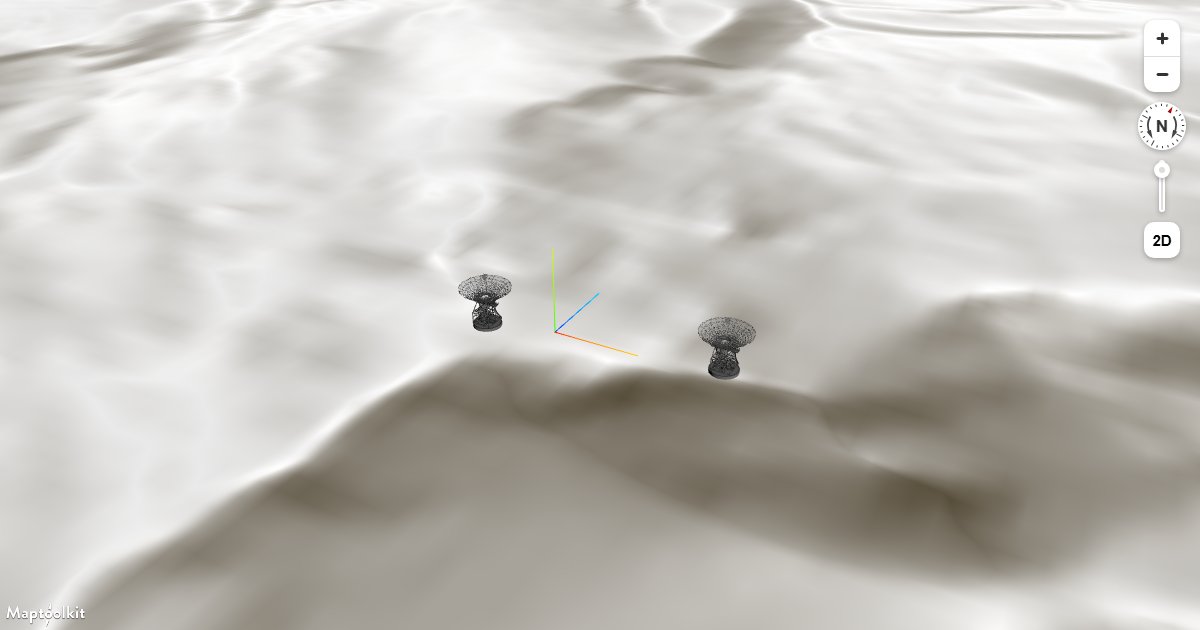
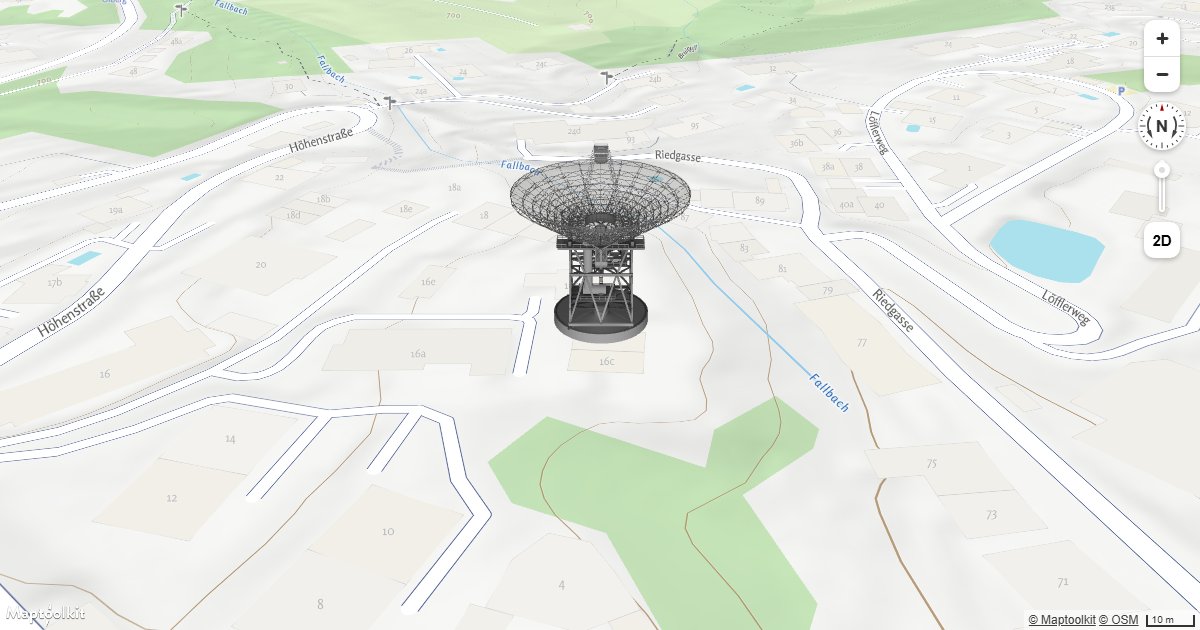
Adding 3D Models Using three.js on Terrain
Place three.js GLTF models on a Maptoolkit map that has 3D terrain enabled, keeping models anchored to the elevated surface.
Add 3D Tiles Using three.js
Load and render a 3D Tiles dataset on a Maptoolkit map using a three.js custom layer.
Add a 3D Model Using three.js
Place a GLTF 3D model at a geographic location on a Maptoolkit map using a three.js custom layer.
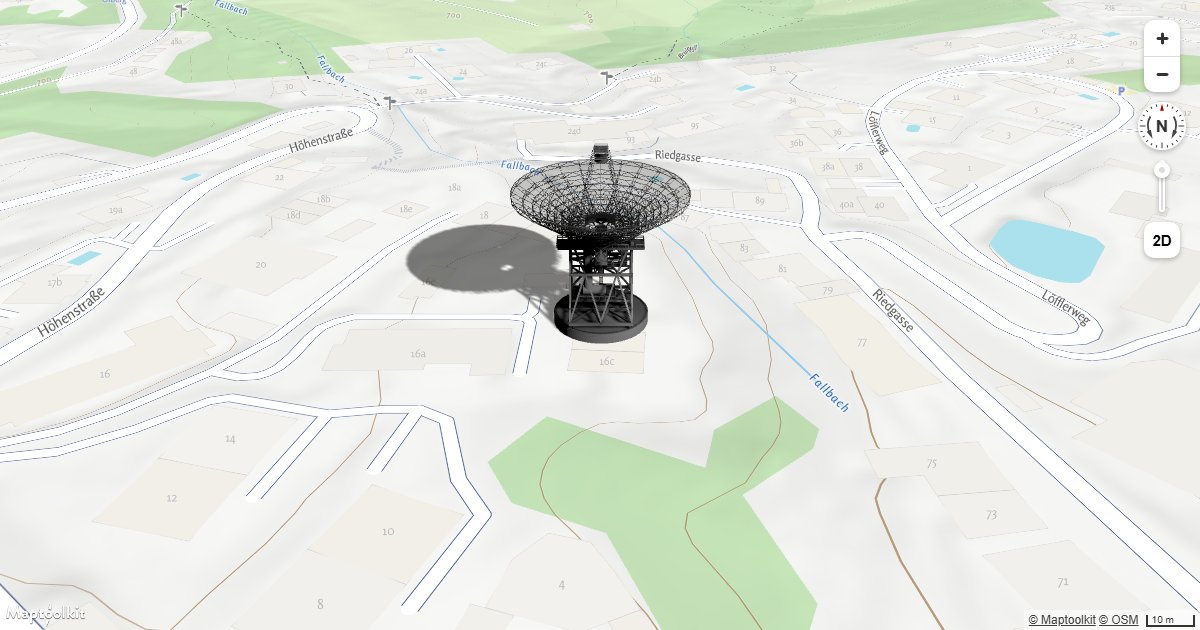
Add a 3D Model with Shadow Using three.js
Render a GLTF 3D model with realistic shadow casting on a Maptoolkit map using three.js.
API Integrations
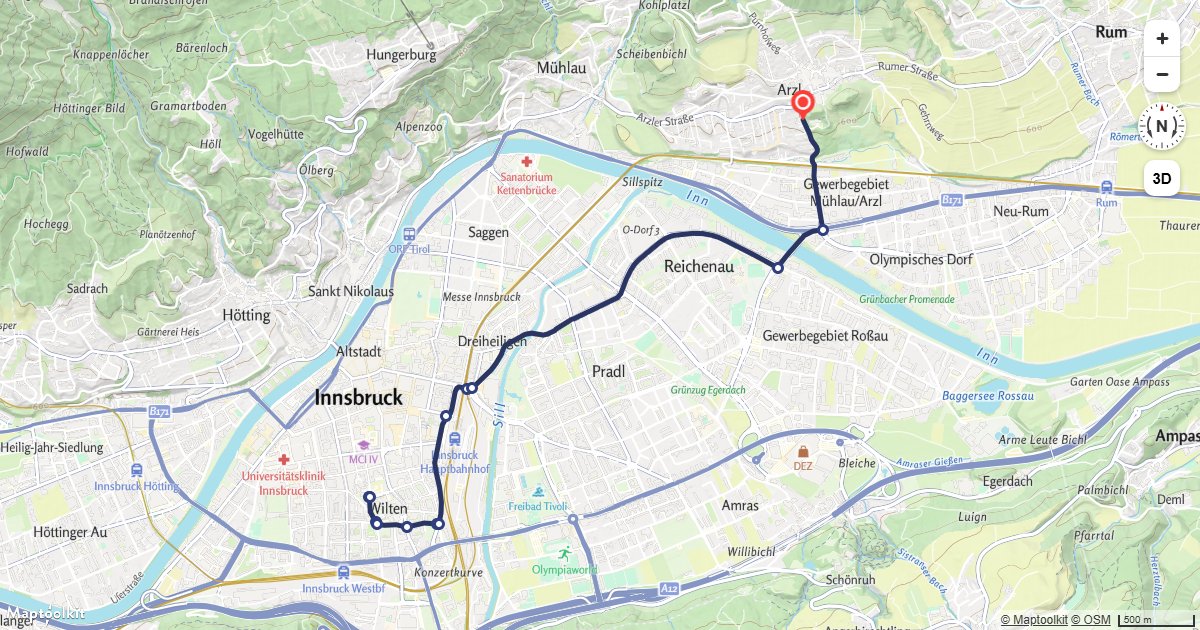
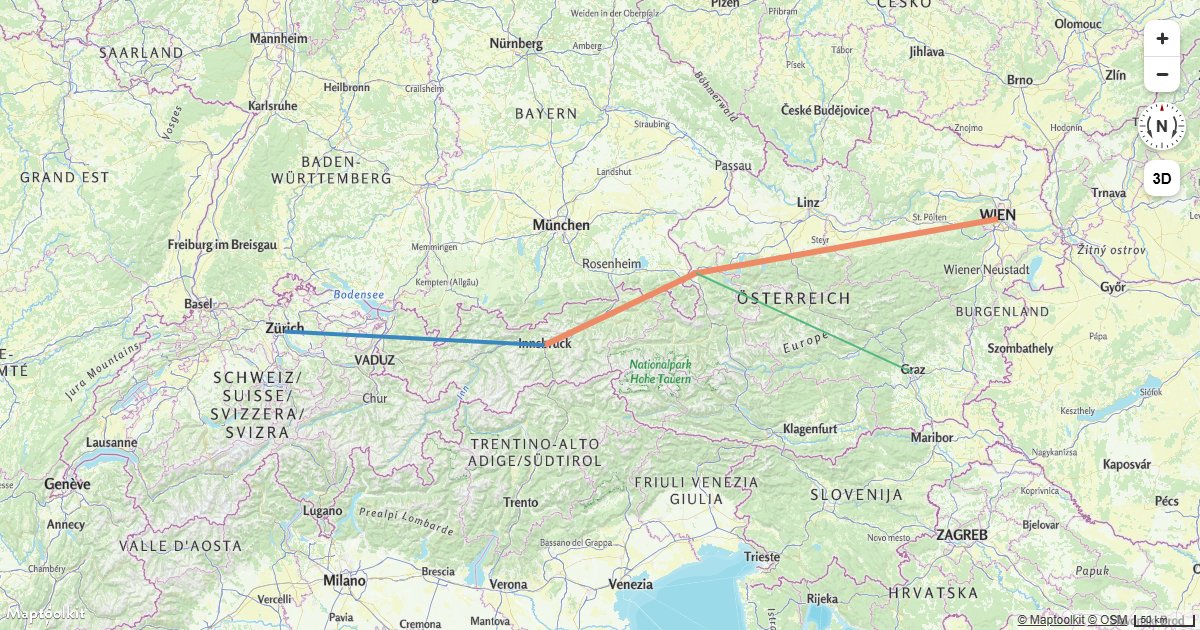
Routing - Route Display
Calculate a car route and draw it on a Maptoolkit map with turn-by-turn markers.
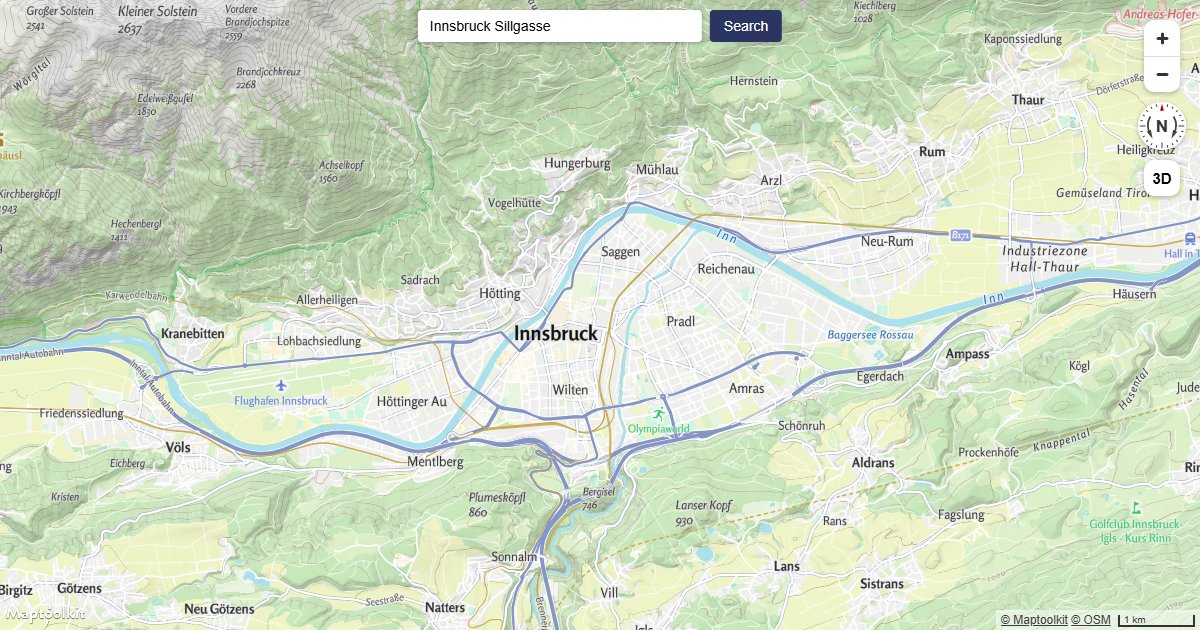
Geocoding - Geocoder Search
Search for a place using the Geocoding API and fly to the result on a Maptoolkit map.
Isochrone - Walking Area
Show a draggable isochrone area on a Maptoolkit map using the built-in IsochroneControl.
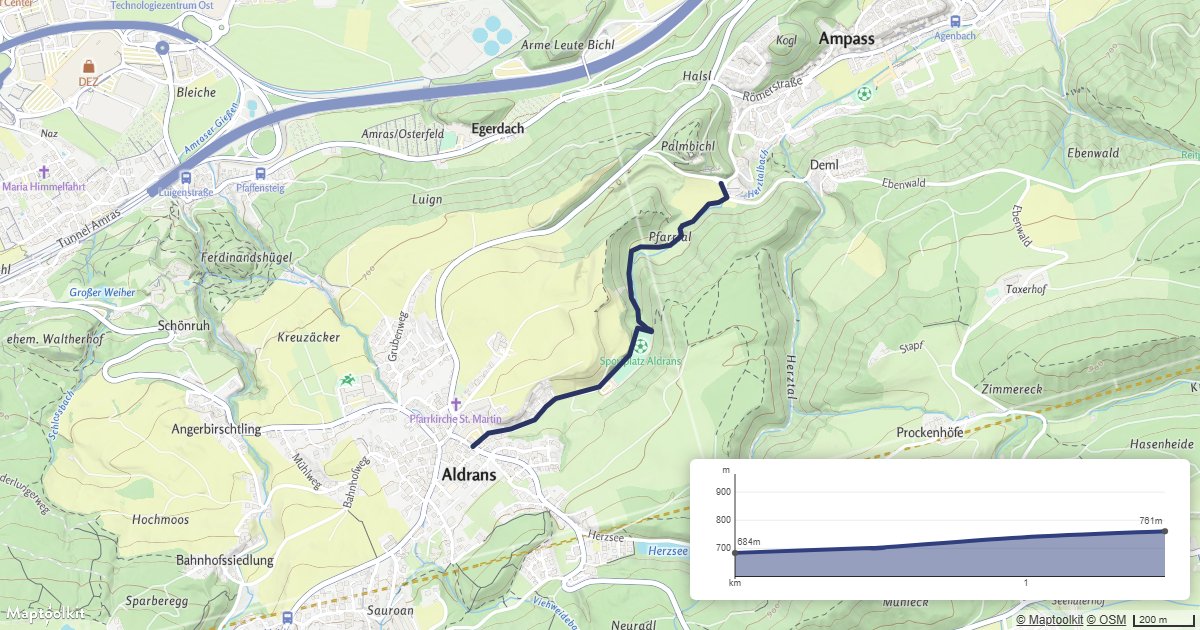
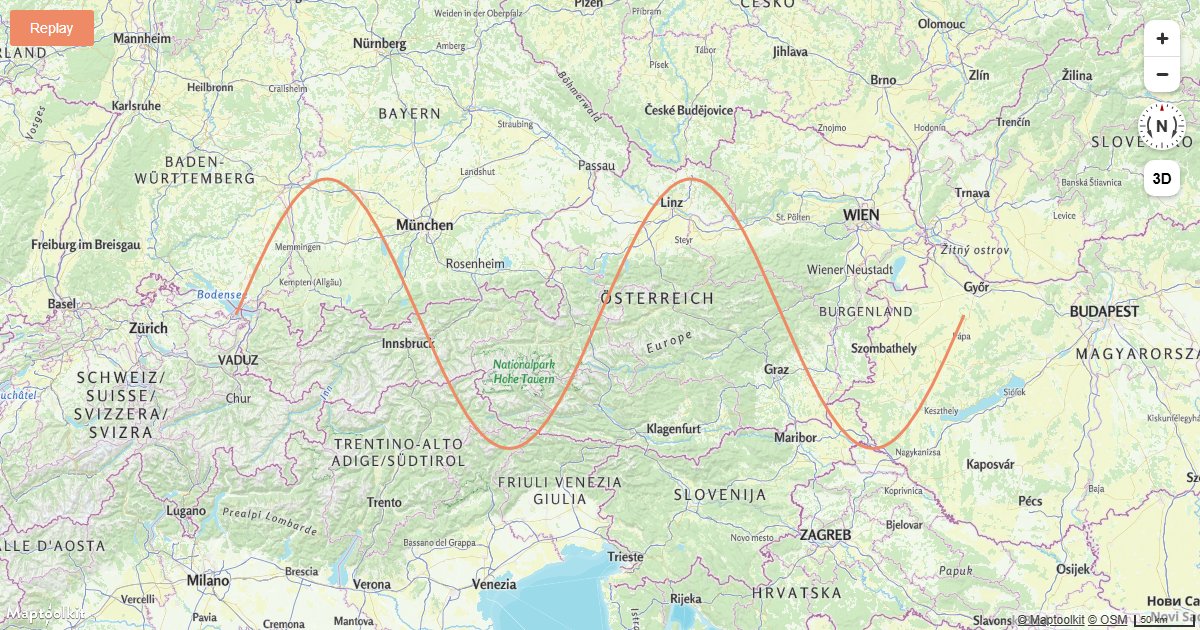
Elevation - Elevation Profile
Show a route with an interactive elevation profile on a Maptoolkit map.
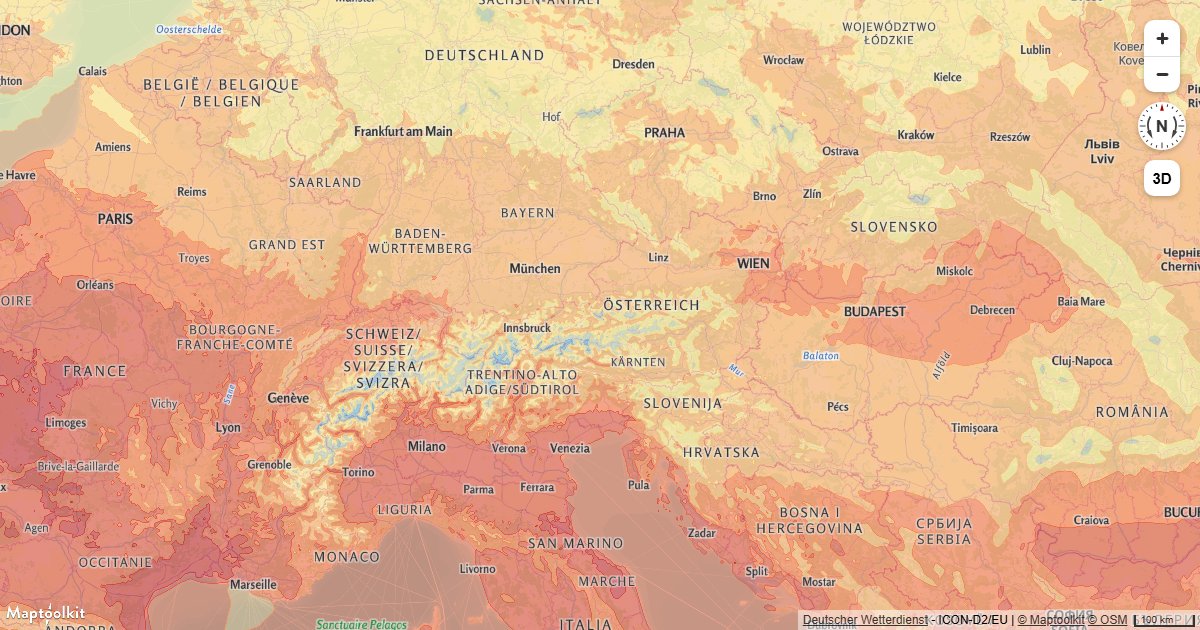
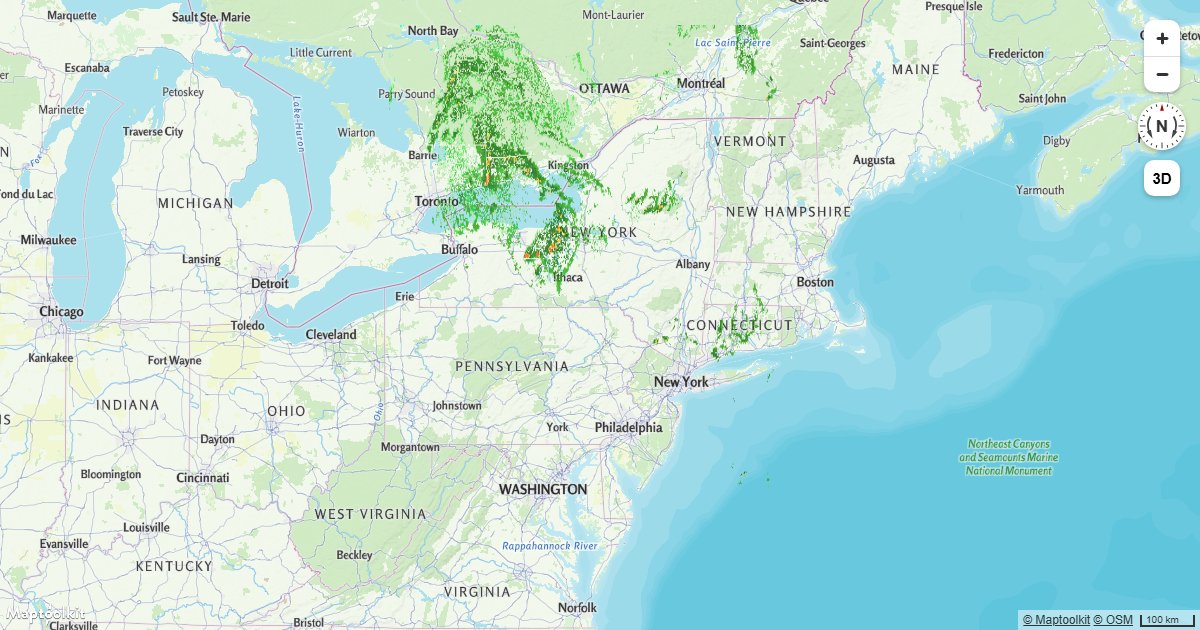
Weather - Temperature Layer
Add a temperature heat map layer from the Weather API to a Maptoolkit map.
Events & Interaction
Center the Map on a Clicked Symbol
Fly the Maptoolkit map camera to a symbol feature's location when the user clicks on it.
Create a Hover Effect
Highlight a map feature on hover using Maptoolkit feature state and a data-driven paint expression.
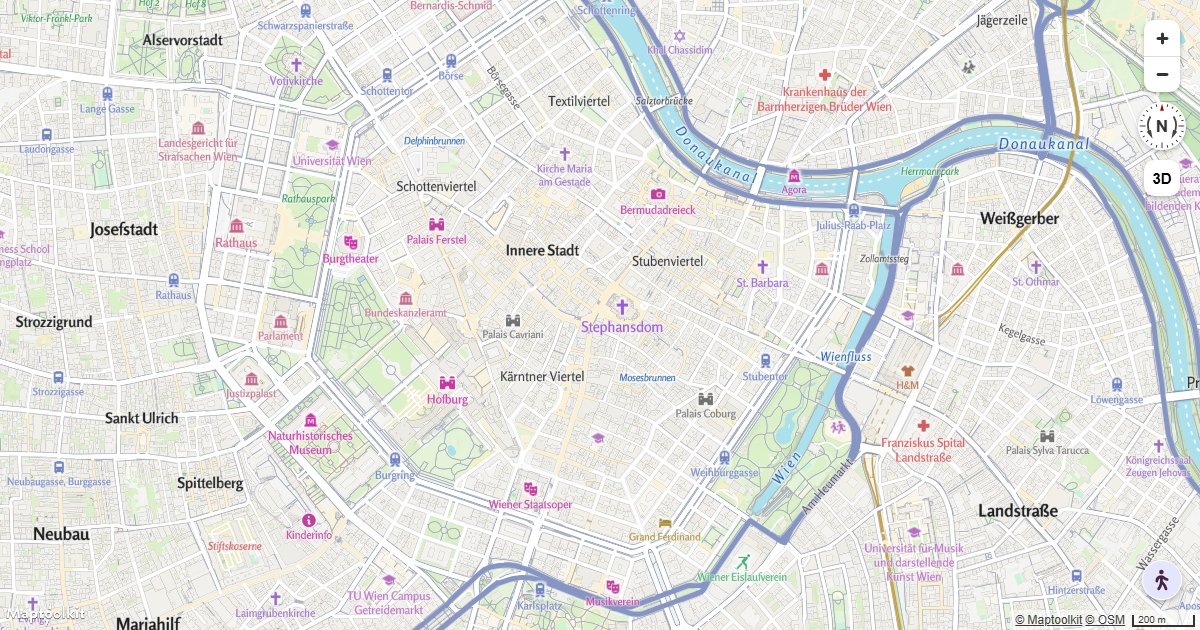
Display a Popup on Click
Show a Maptoolkit Popup with the clicked coordinates whenever a user clicks anywhere on the map.
Display a Popup on Hover
Show a Maptoolkit Popup with feature properties when the user hovers over a point on the map.

Get Coordinates of the Mouse Pointer
Display the longitude and latitude under the cursor in real time as the user moves the mouse over a Maptoolkit map.
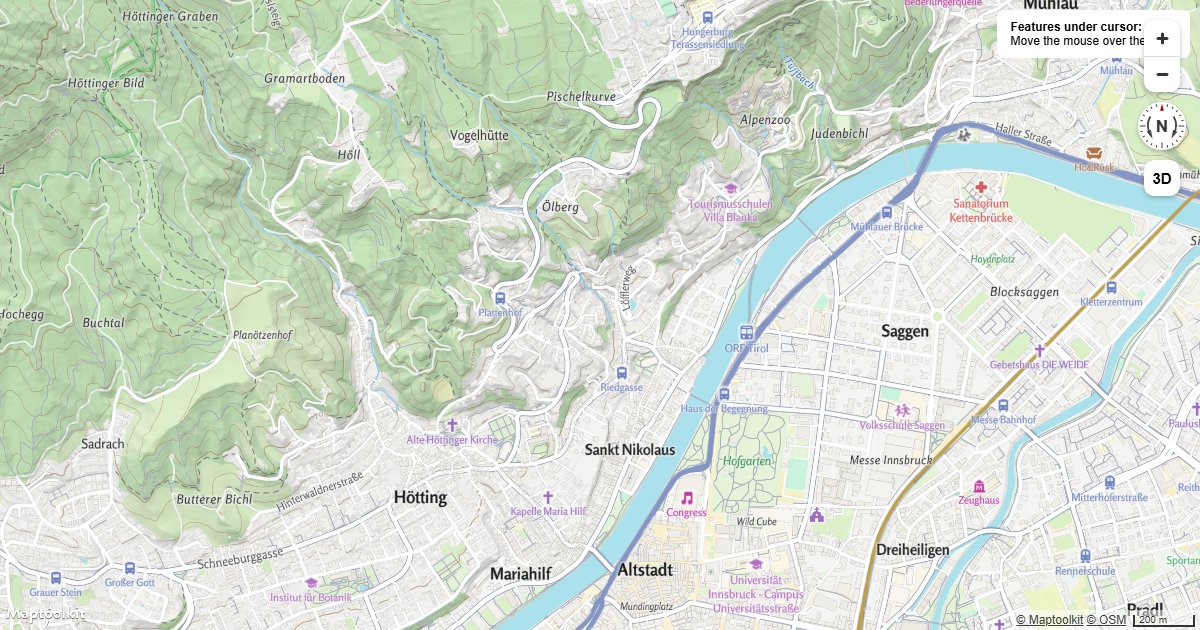
Get Features Under the Mouse Pointer
Query all rendered Maptoolkit map features under the mouse cursor and display their properties on hover.
Show Polygon Information on Click
Display a Maptoolkit Popup with GeoJSON feature properties when the user clicks on a polygon layer.

Create a Draggable Point
Create a draggable GeoJSON point on a Maptoolkit map layer using mousedown, mousemove, and mouseup events.
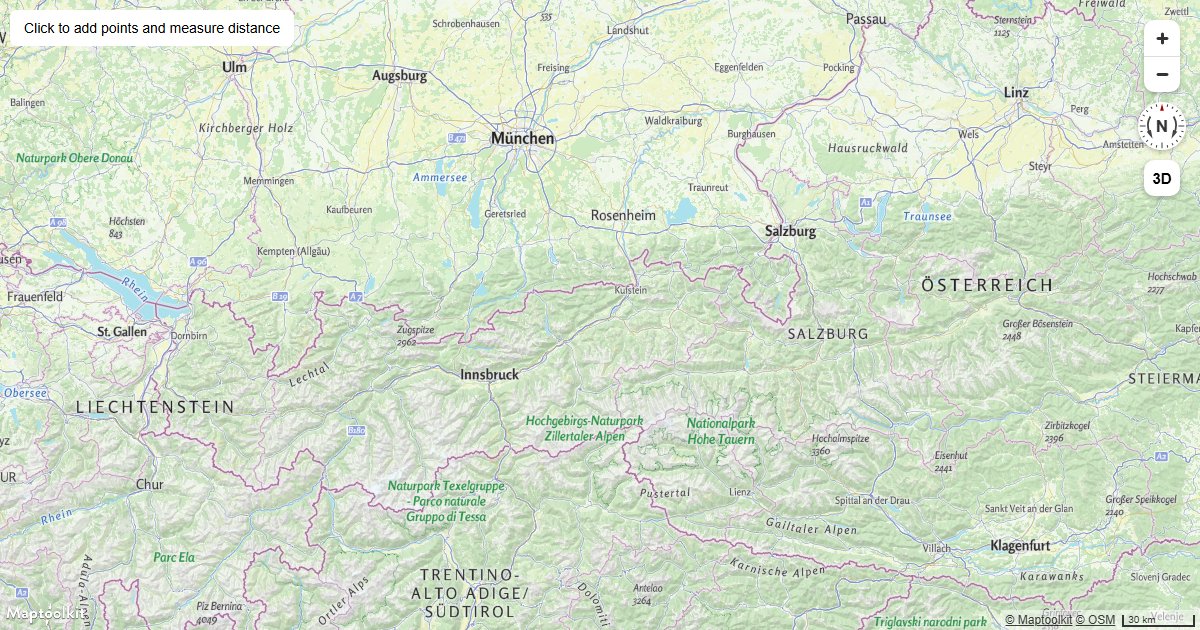
Measure Distances
Place points by clicking a Maptoolkit map and measure the total distance between them using Turf.js.

Animate a Symbol to Follow the Mouse
Move a symbol layer feature to the current mouse position on every mousemove event on a Maptoolkit map.
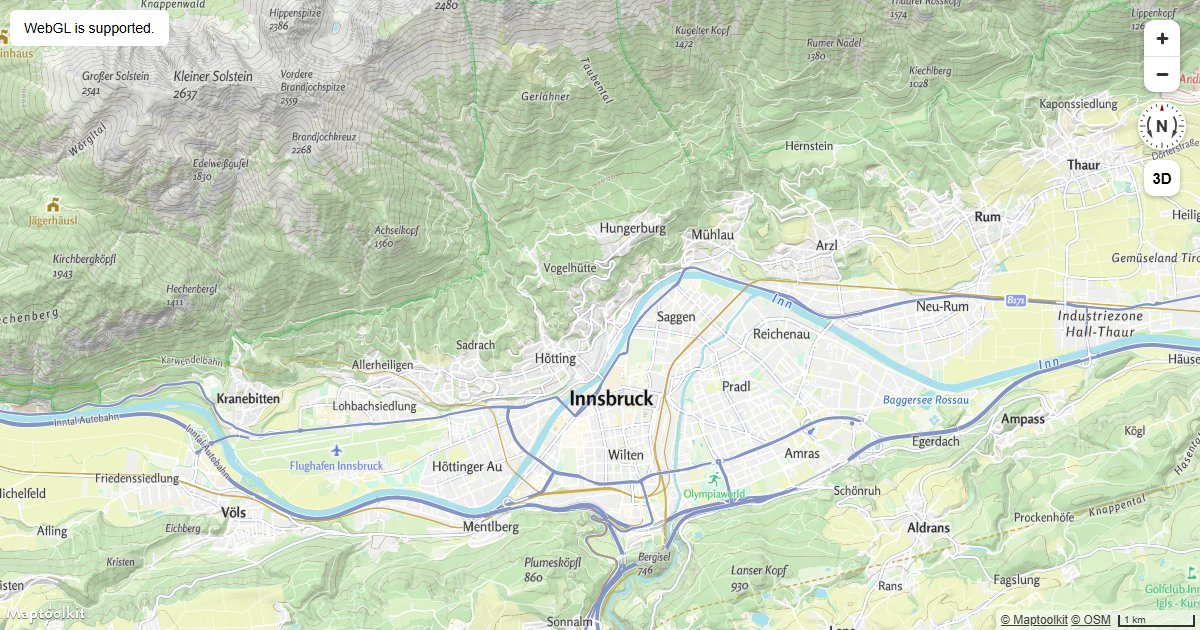
Check if WebGL is Supported
Detect WebGL support before initializing a Maptoolkit map and show a fallback message when it is unavailable.
Camera & Navigation
Pitch and Bearing
Initialize a Maptoolkit map with a custom pitch and bearing to set a tilted or rotated starting view.
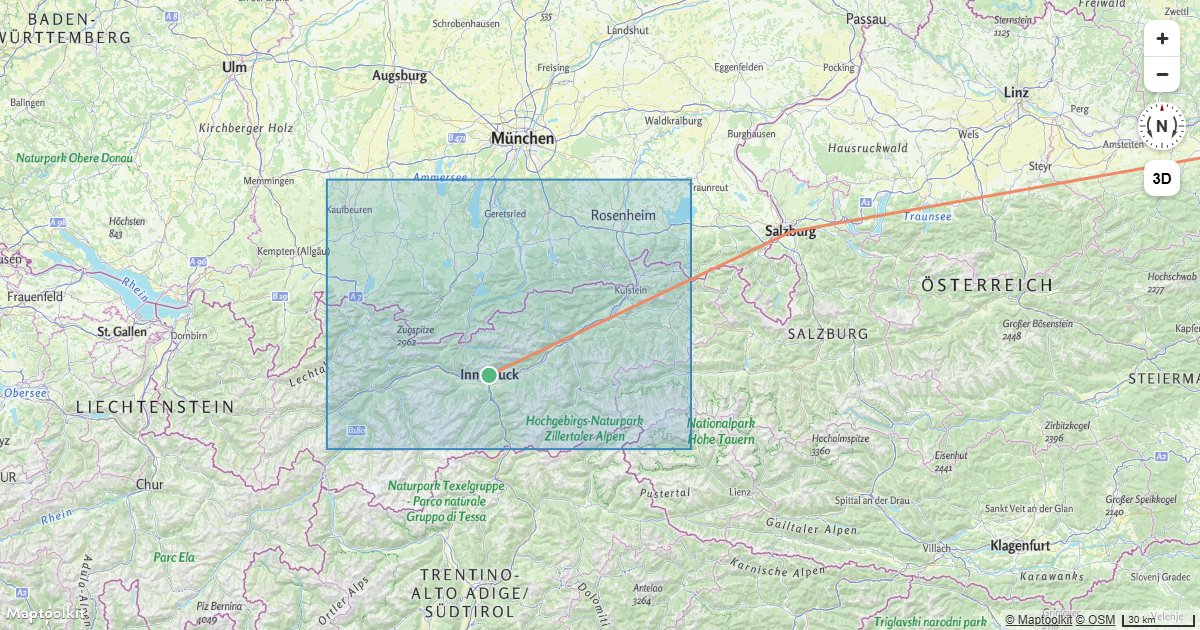
Fit a Map to a Bounding Box
Fit a Maptoolkit map view to a geographic bounding box using fitBounds with optional padding.
Fly to a Location
Animate the Maptoolkit map camera to a new location with a smooth arc-based fly-to transition.
Animate Map Camera Around a Point
Continuously rotate the Maptoolkit map camera around a fixed center point using a requestAnimationFrame loop.
Fly to a Location Based on Scroll Position
Drive Maptoolkit map camera movements by scroll position to create a scroll-linked map storytelling effect.
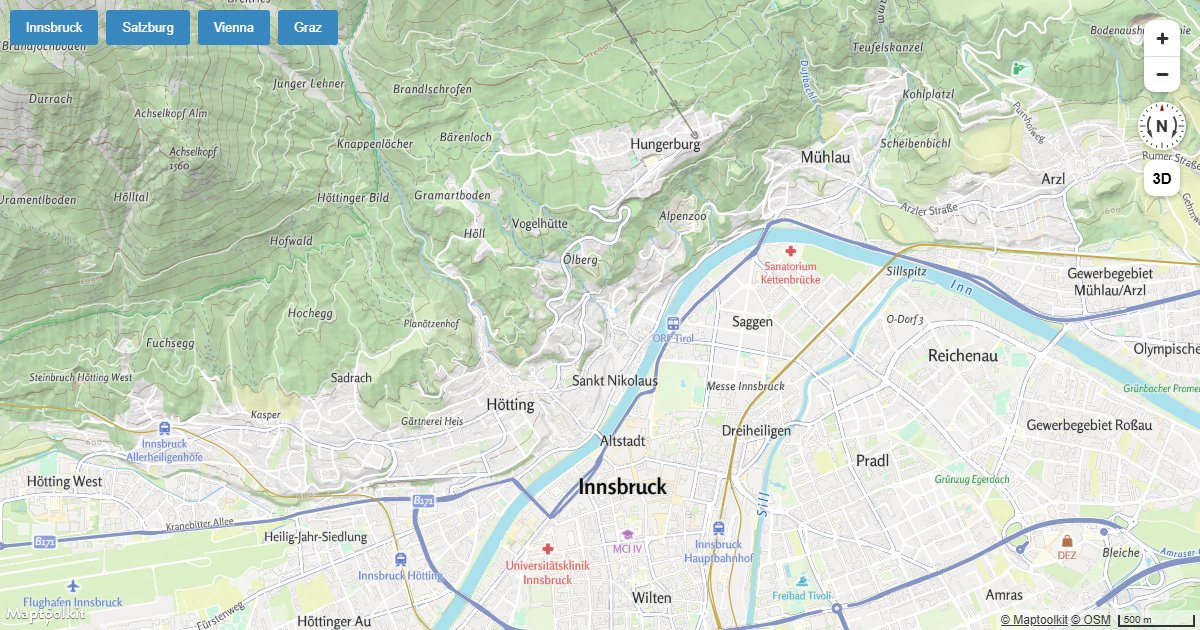
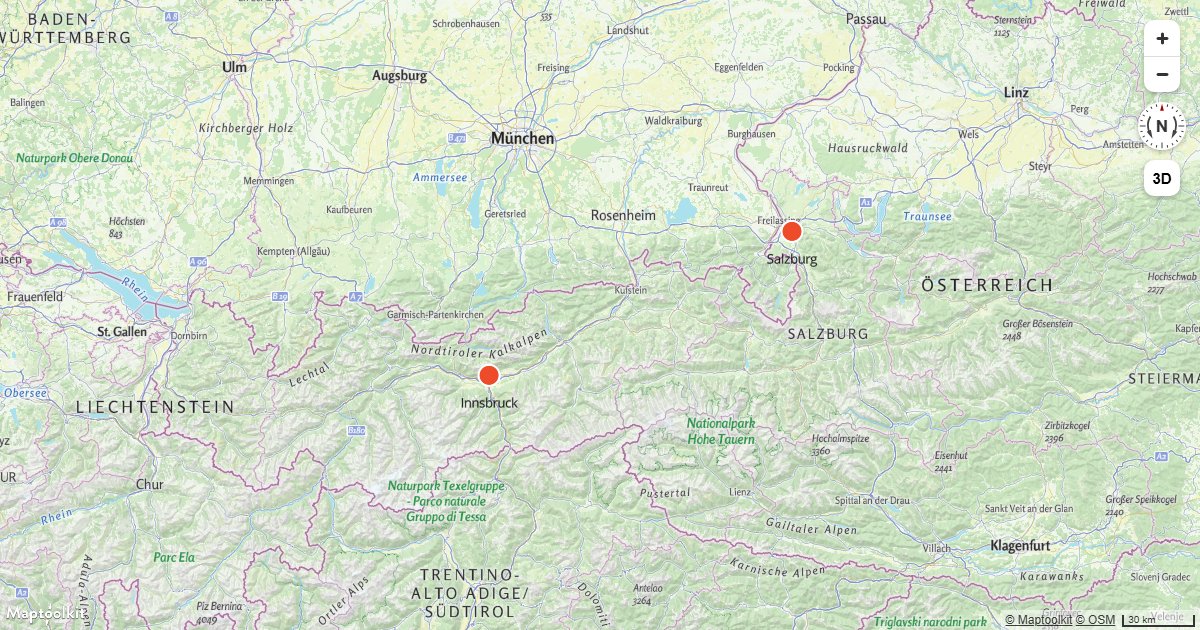
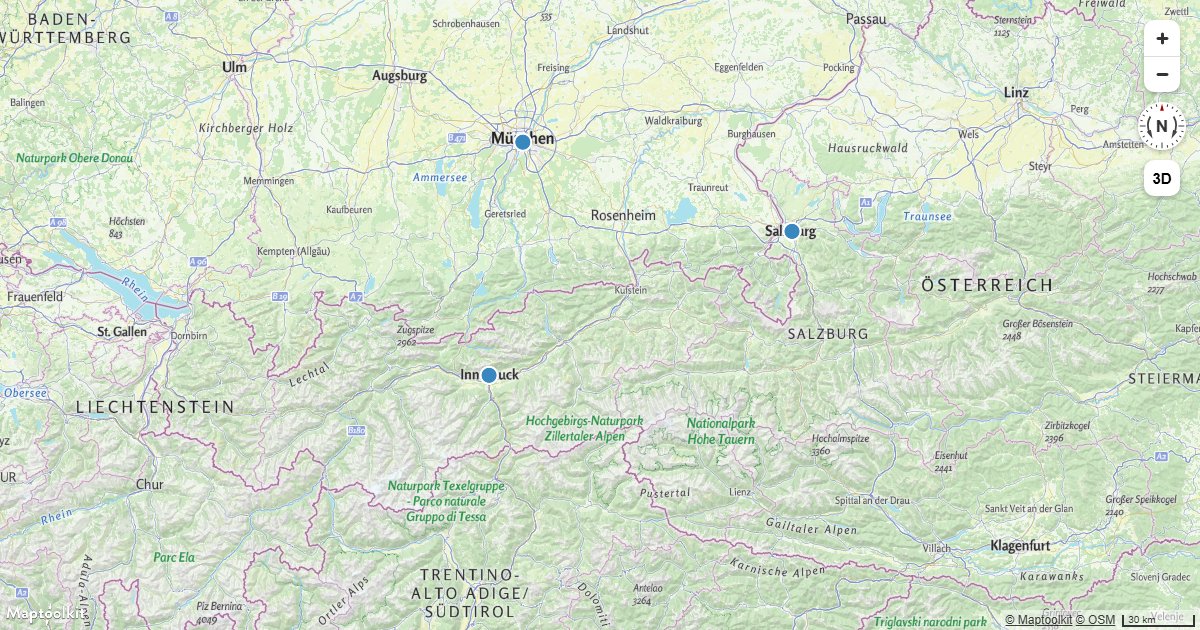
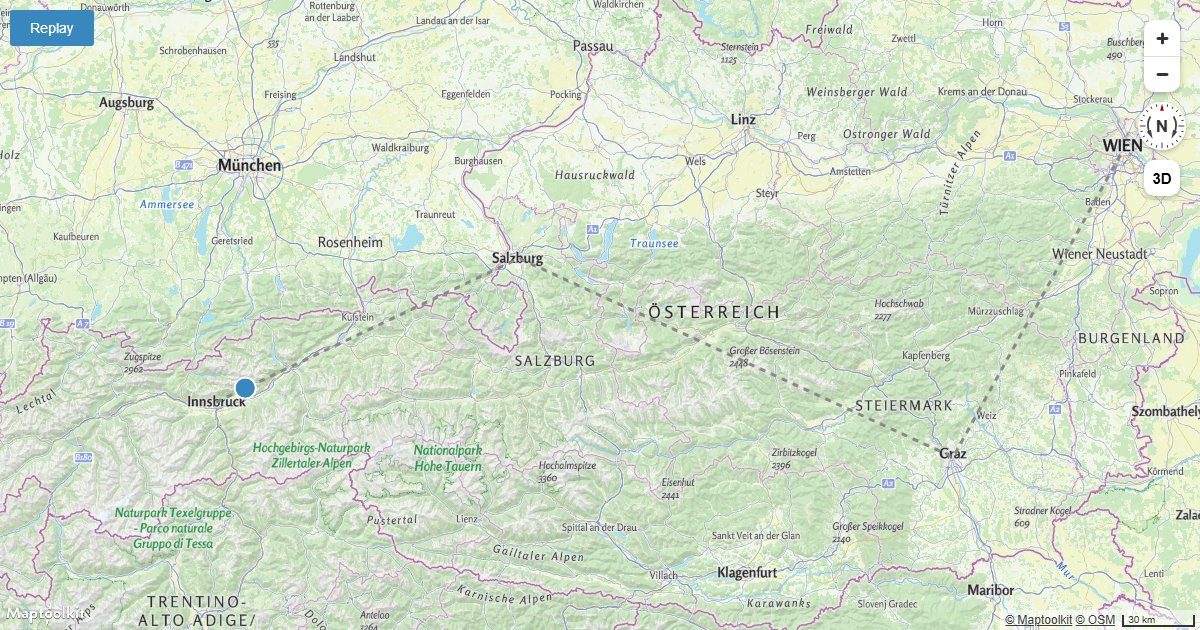
Jump to a Series of Locations
Instantly jump the Maptoolkit map camera through a sequence of locations using map.jumpTo.
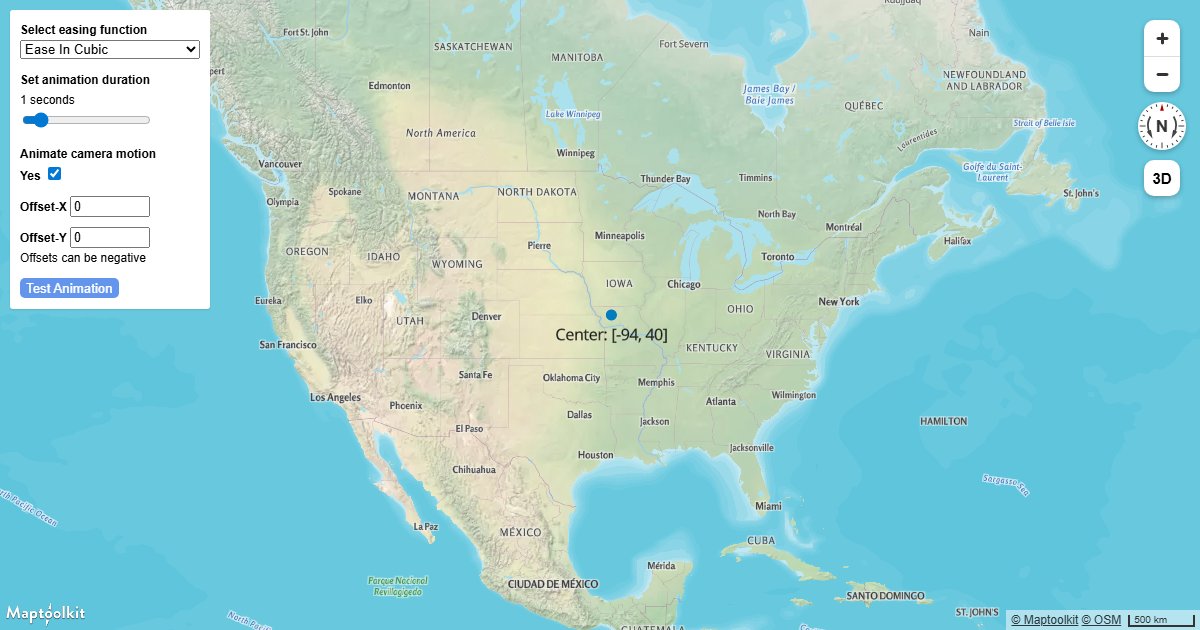
Customize Camera Animations
Customize the speed, easing, and duration of Maptoolkit camera transitions using AnimationOptions.
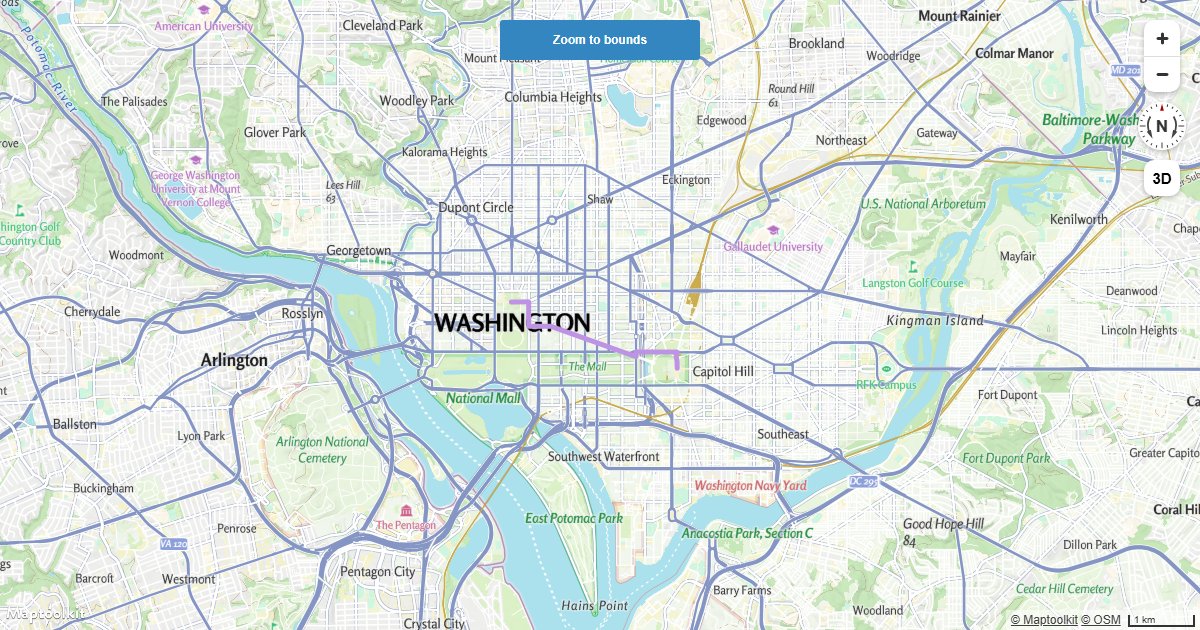
Fit to the Bounds of a LineString
Automatically fit a Maptoolkit map to the bounding box of a GeoJSON LineString using fitBounds.
Restrict Map Bounds
Lock a Maptoolkit map to a geographic bounding box so users cannot pan or zoom outside the defined area.

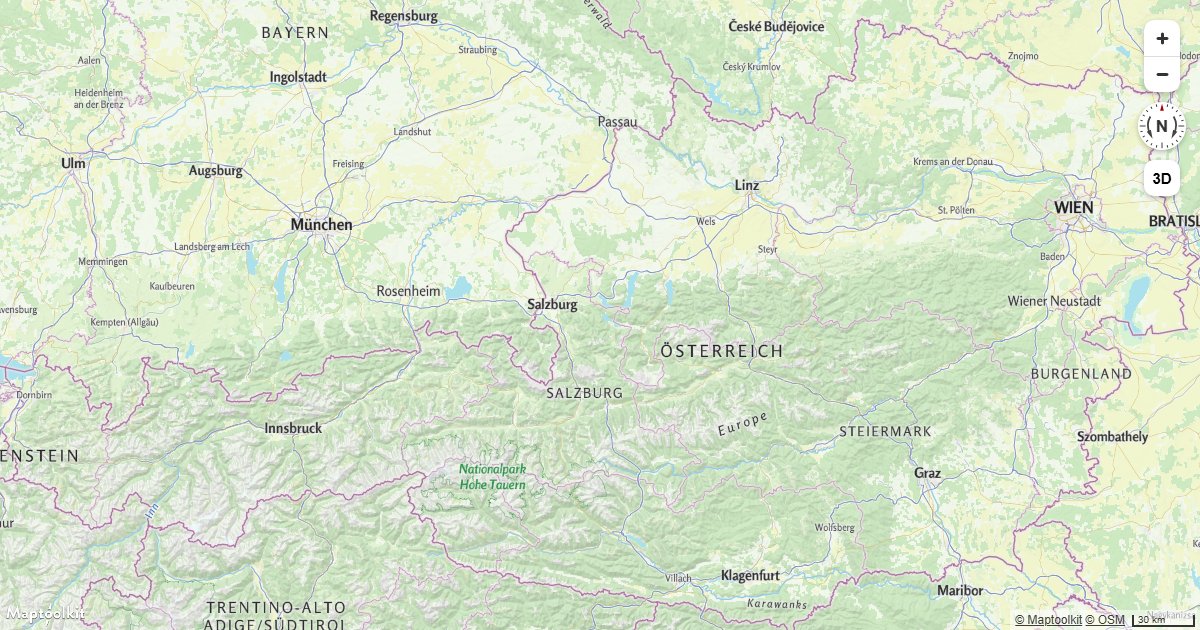
Disable Map Rotation
Prevent users from rotating a Maptoolkit map so it always stays oriented north-up.
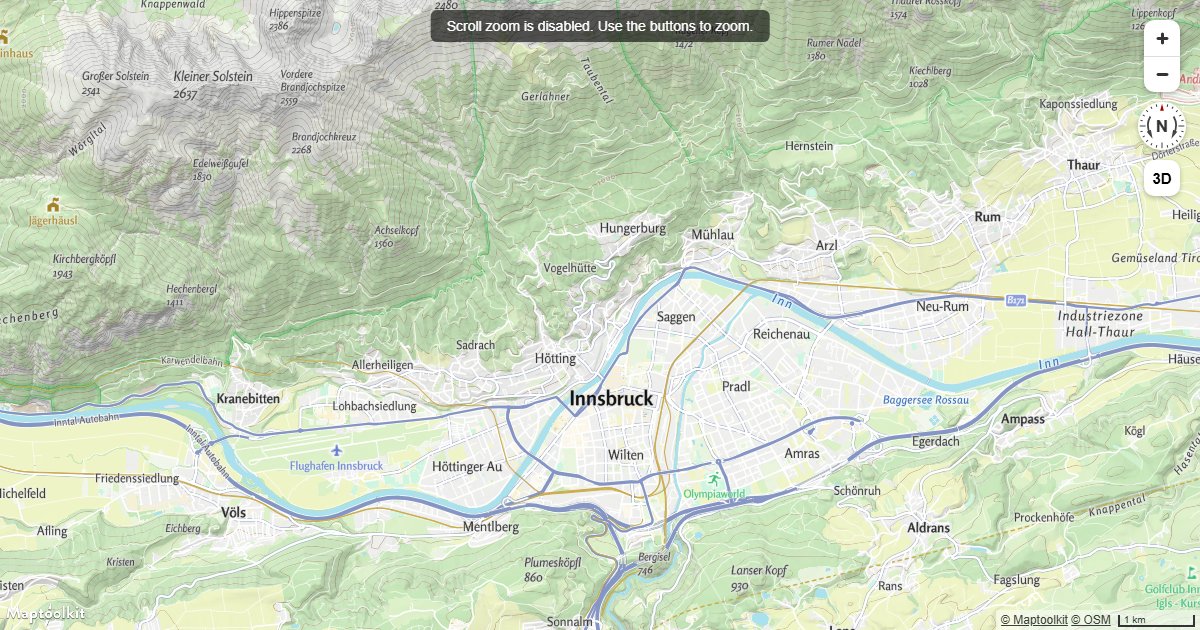
Disable Scroll Zoom
Disable scroll wheel zoom on a Maptoolkit map so mouse scrolling over the map navigates the page instead.
Globe
Display a Globe with a Vector Map
Render a Maptoolkit vector map as a 3D globe using the globe projection setting.
Display a Globe with an Atmosphere
Render a Maptoolkit globe with a realistic atmospheric haze and sky gradient using the fog style property.
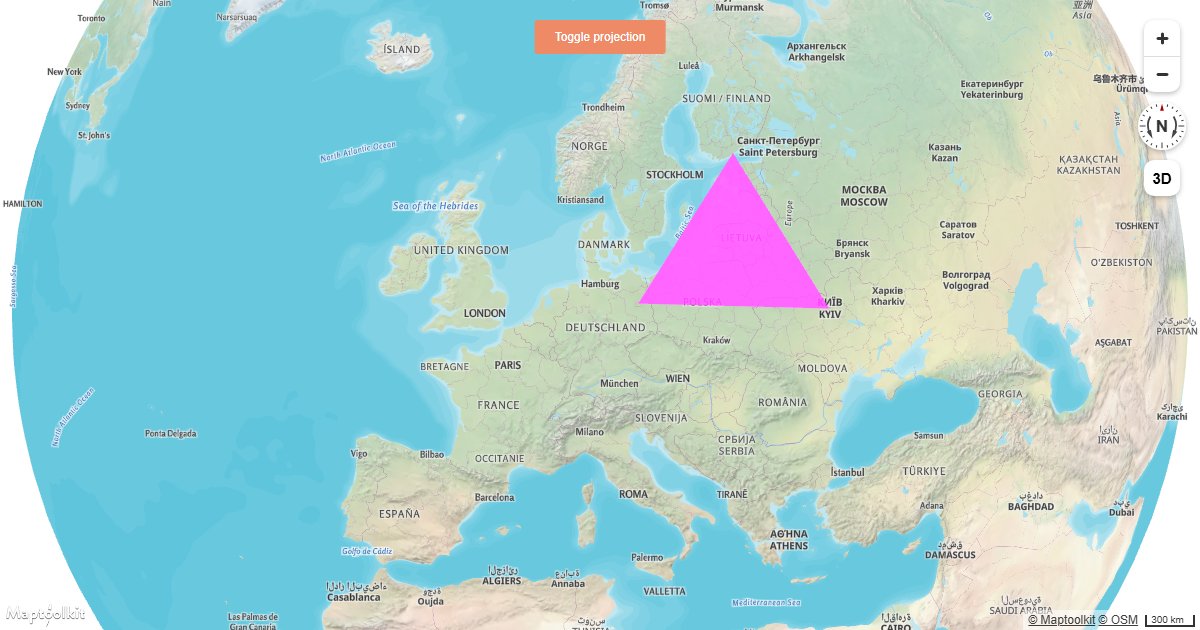
Add a Simple Custom Layer on a Globe
Draw custom WebGL content directly on a Maptoolkit globe using a custom layer and the map's render context.
Styles & Expressions
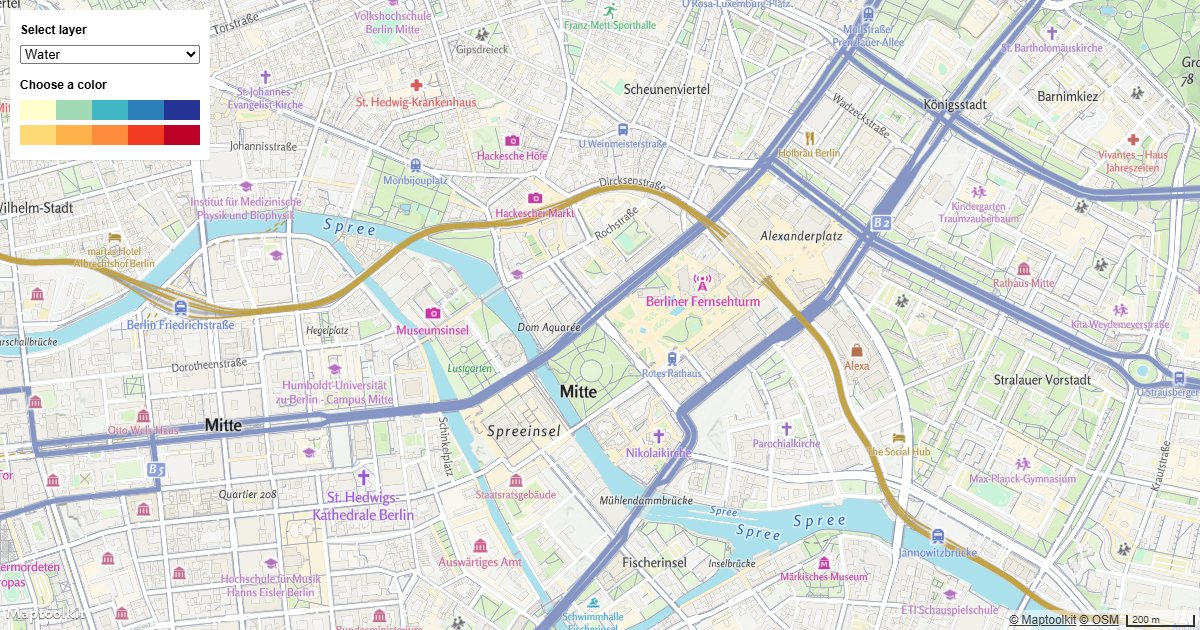
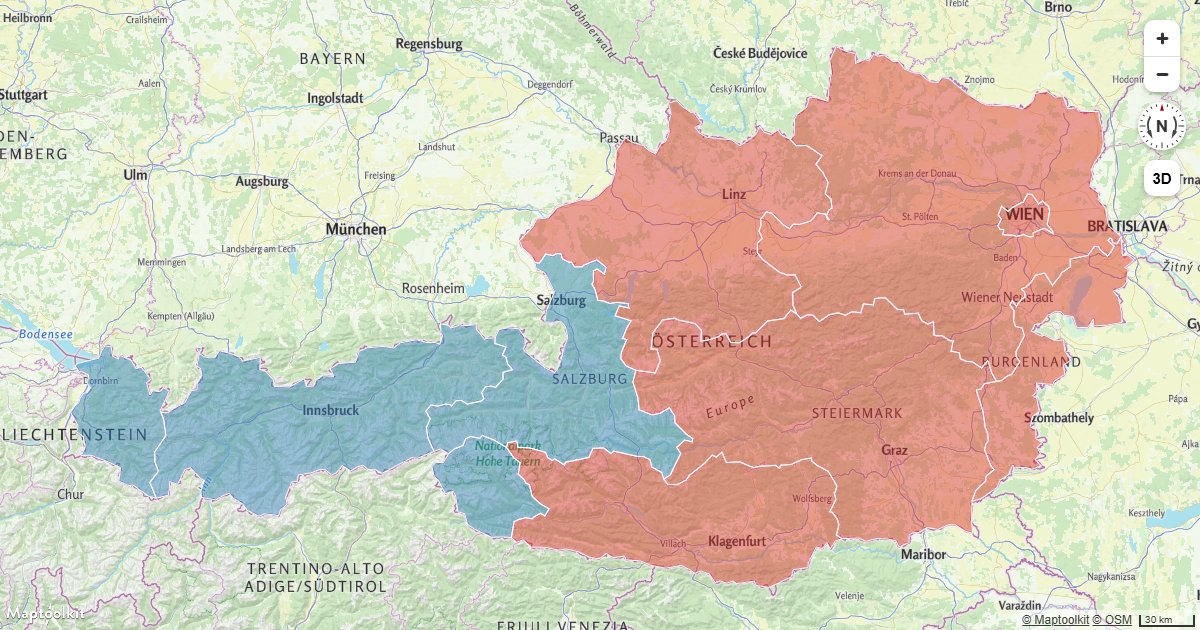
Change a Layer's Color with Buttons
Update a Maptoolkit map layer's fill color at runtime using UI buttons and setPaintProperty.
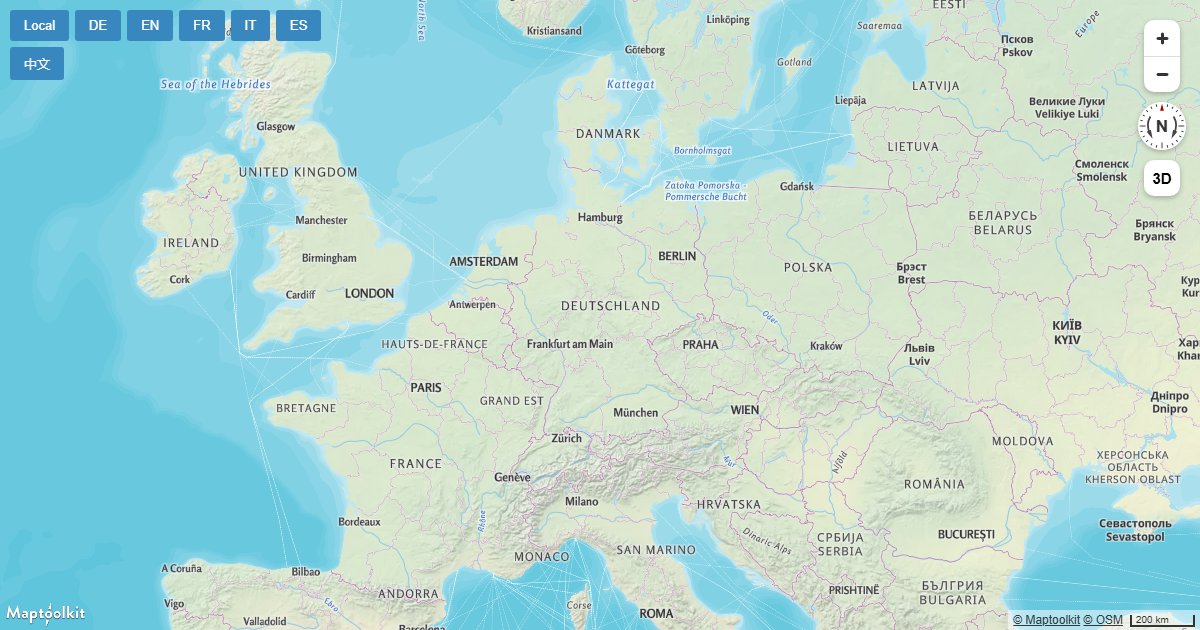
Change a Map's Language
Switch the display language of Maptoolkit map labels at runtime by updating the text-field expression on symbol layers.
Change Building Color Based on Zoom Level
Apply zoom-dependent color expressions to Maptoolkit building layers using interpolate style expressions.
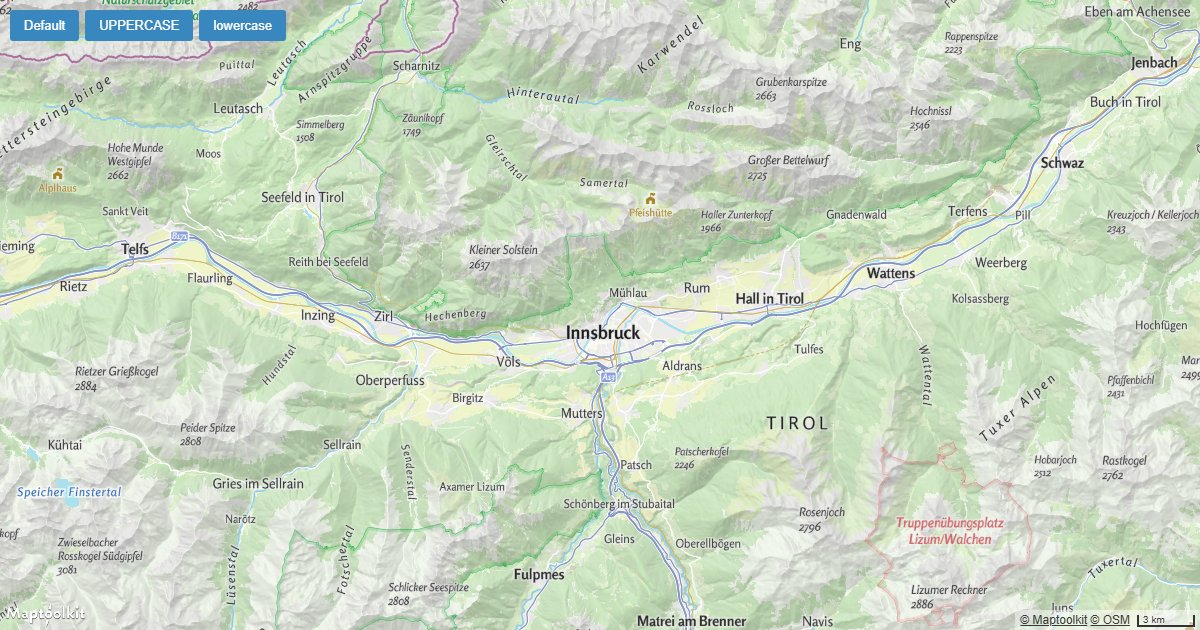
Change the Case of Labels
Set map label text to uppercase, lowercase, or title case on a Maptoolkit map using the text-transform layout property.

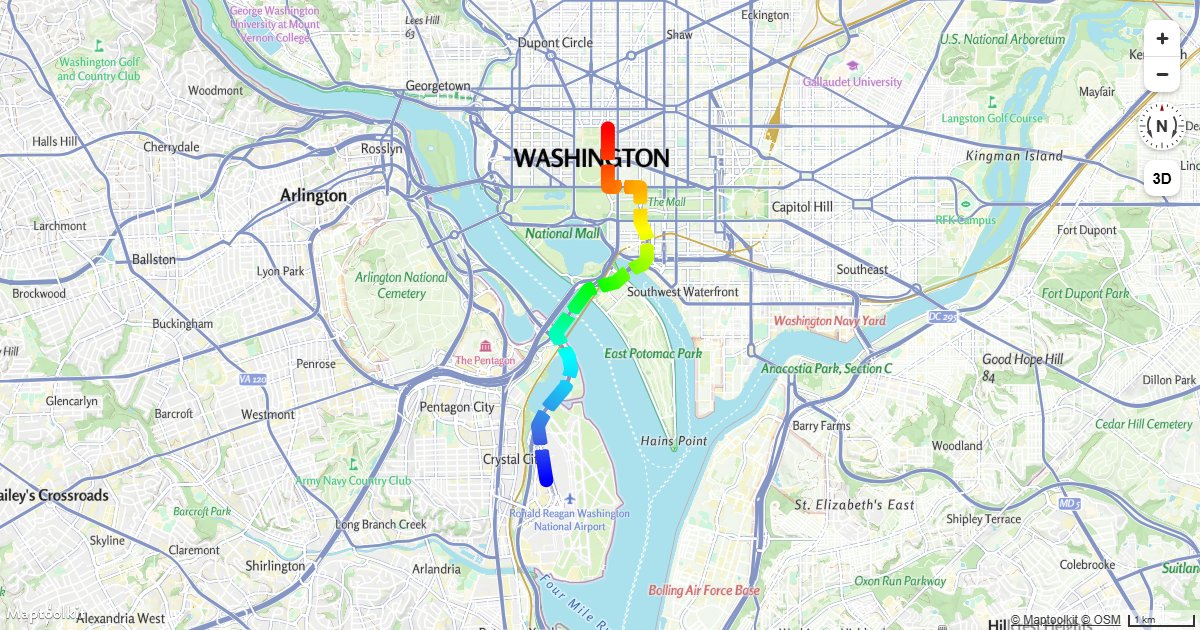
Create a Gradient Line Using an Expression
Apply a smooth color gradient along a line layer on a Maptoolkit map using a line-gradient style expression.
Create a Gradient Dashed Line Using an Expression
Combine a line-gradient expression with line-dasharray to render a color-gradated dashed line on a Maptoolkit map.
Style Lines with a Data-Driven Property
Style Maptoolkit line layers with variable width and color driven by GeoJSON feature properties.
Add a New Layer Below Labels
Insert a fill or line layer below Maptoolkit map labels to keep text legible over your data.
Add a Pattern to a Polygon
Fill a GeoJSON polygon with a repeating image pattern using a Maptoolkit fill-pattern layer.
Change the Default Position for Attribution
Reposition the Maptoolkit attribution control to any corner of the map container using the attributionControl option.
Layers & Data
Add a Vector Tile Source
Add an external vector tile source to a Maptoolkit map and apply custom styles to its layers.
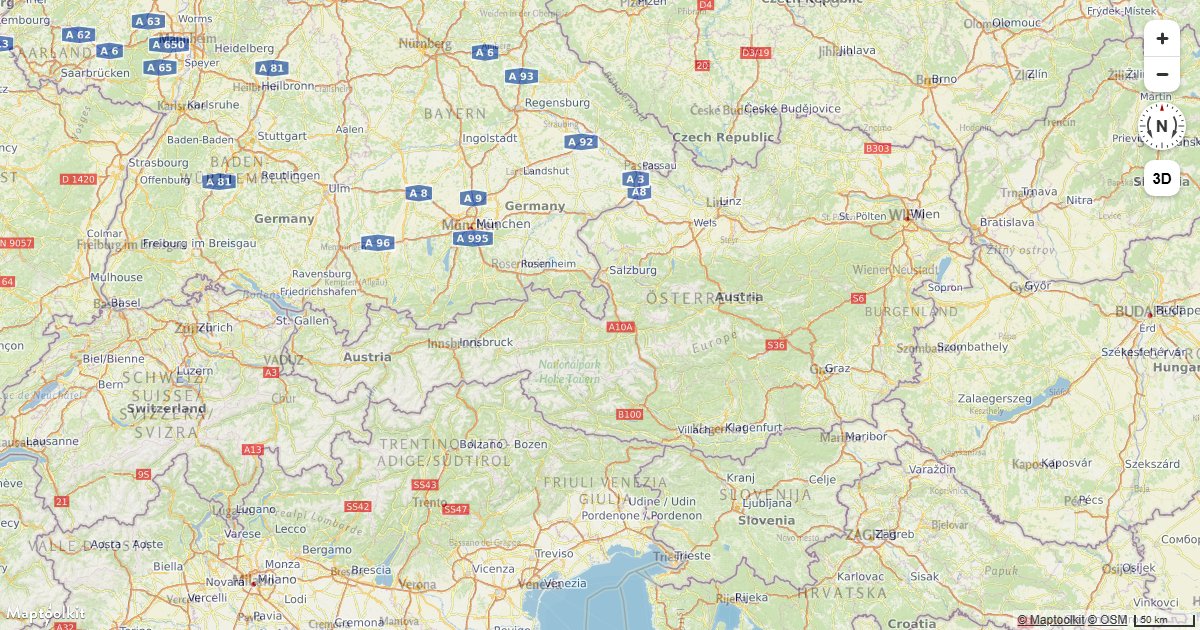
Add a Raster Tile Source
Add an external raster tile source and display it as a layer on a Maptoolkit map.
Add a WMS Source
Connect a WMS (Web Map Service) endpoint as a raster source on a Maptoolkit map.
Add a Canvas Source
Use an HTML canvas element as a live animated map source to overlay dynamic graphics on a Maptoolkit map.
Draw GeoJSON Points
Add a GeoJSON point source to a Maptoolkit map and render the points as a styled circle layer.
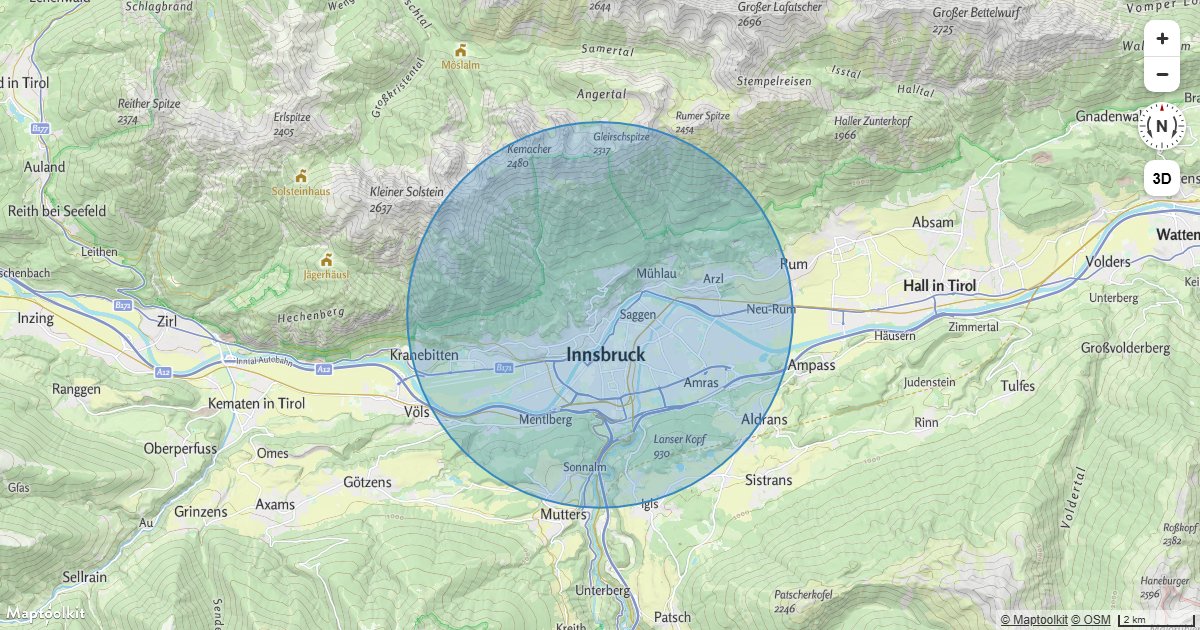
Draw a Circle
Draw a geographic circle at a radius in meters on a Maptoolkit map using a GeoJSON polygon approximation.
Add Multiple Geometries from One GeoJSON Source
Render points, lines, and polygons from a single GeoJSON source using multiple Maptoolkit layer types.
Add Live Realtime Data
Fetch live data from an external API on an interval and update a Maptoolkit map source in real time.

Update a Feature in Realtime
Update a GeoJSON feature's coordinates in real time on a Maptoolkit map by calling setData on the source.
Animate a Point
Animate a GeoJSON point moving in a circle on a Maptoolkit map using requestAnimationFrame and setData.
Animate a Line
Animate a growing line on a Maptoolkit map by progressively adding coordinates to a GeoJSON source.
Animate a Point Along a Route
Animate a point icon moving along a fixed route on a Maptoolkit map using Turf.js for position interpolation.
Animate a Series of Images
Cycle through a sequence of images on a Maptoolkit raster source to create a frame-by-frame map animation.
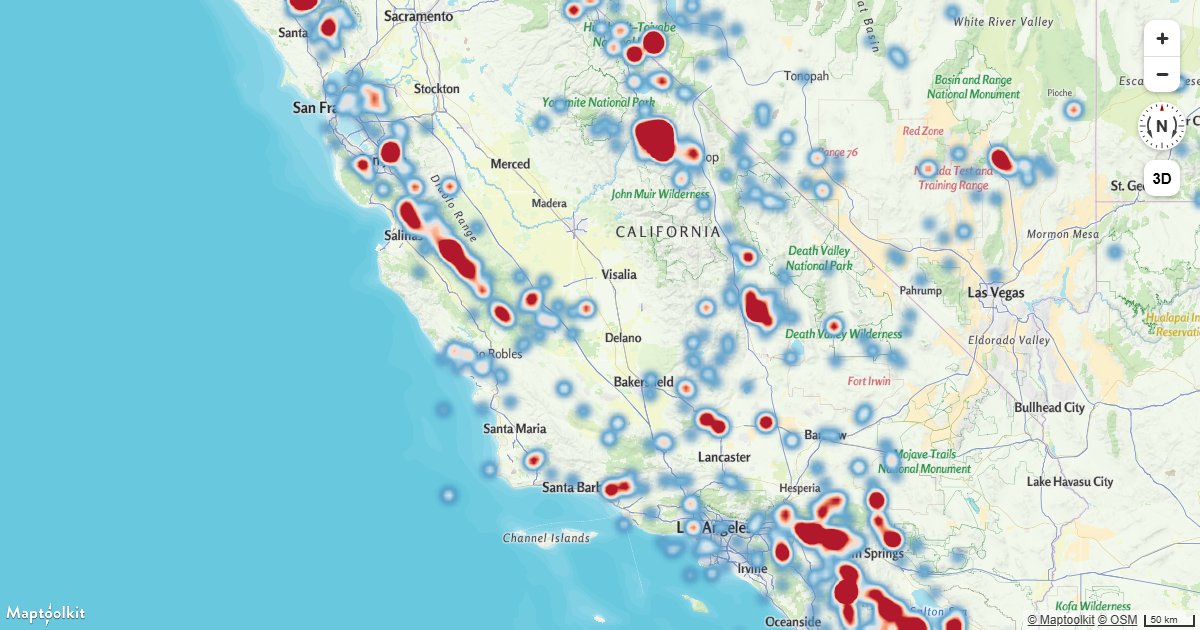
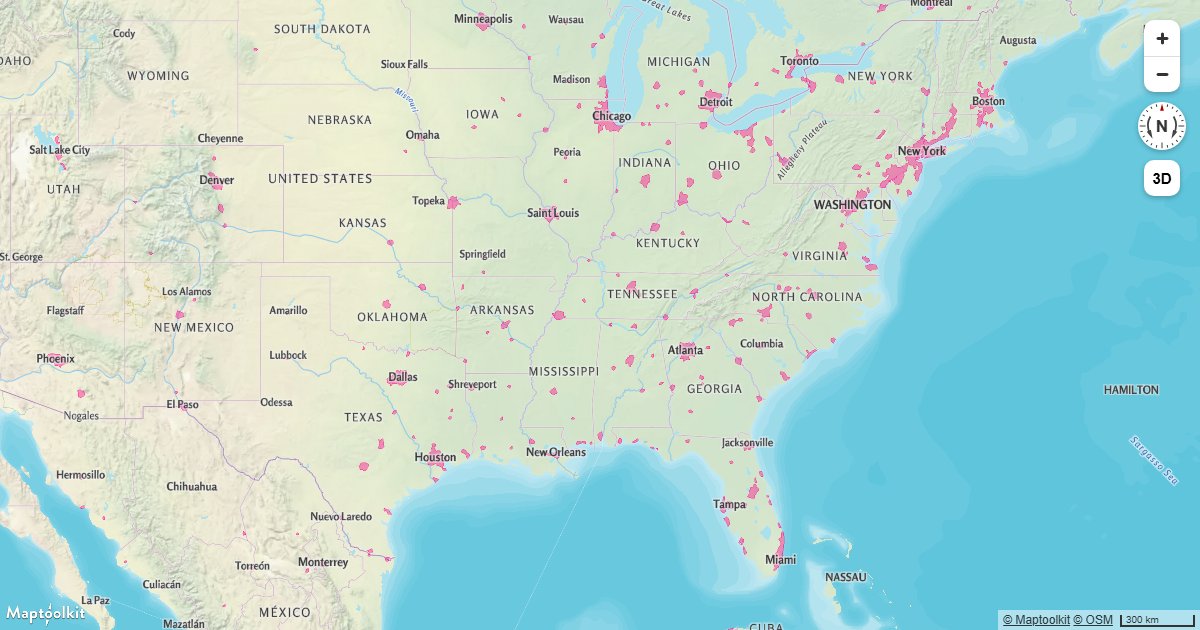
Create a Heatmap Layer
Visualize point density on a Maptoolkit map using a heatmap layer driven by data-driven style expressions.
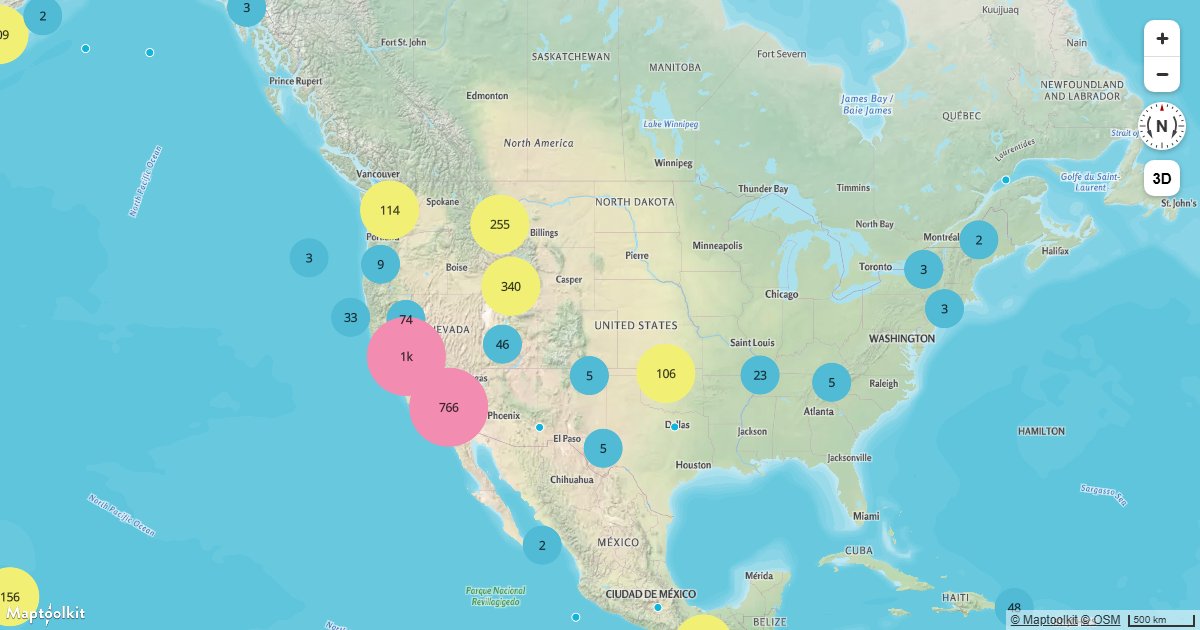
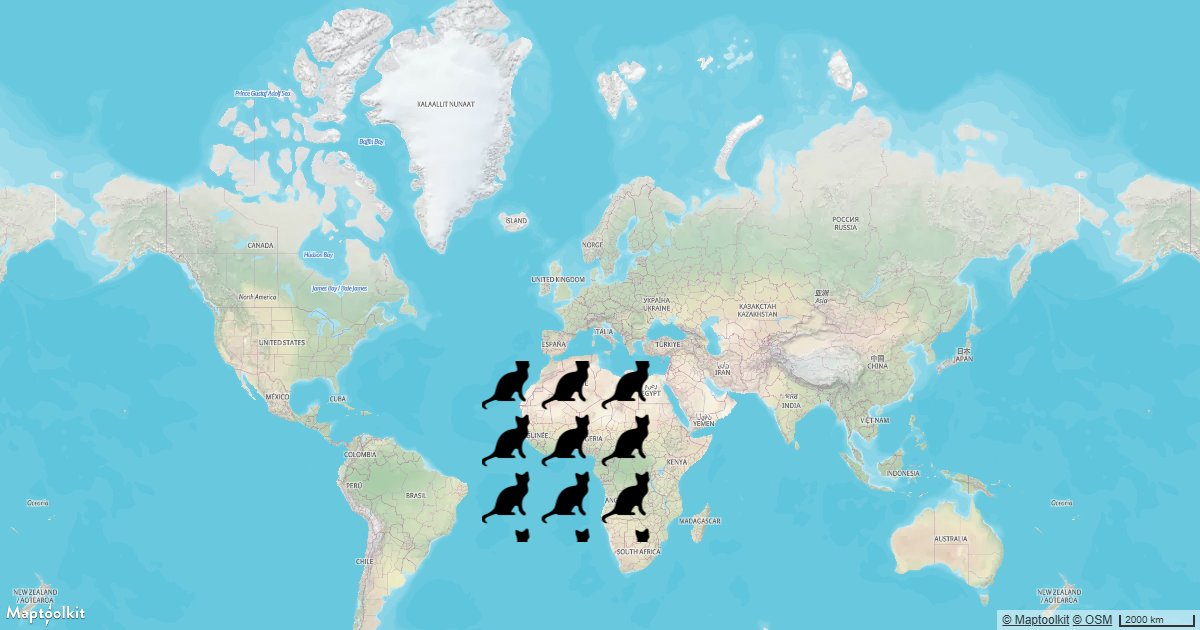
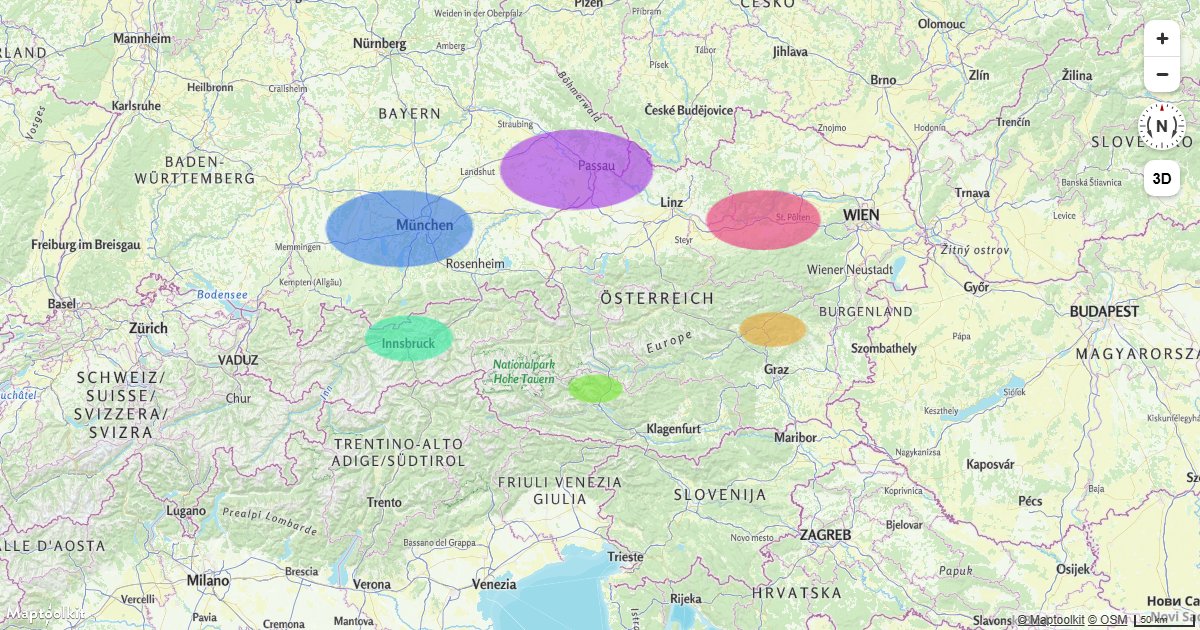
Create and Style Clusters
Group nearby point features into clusters on a Maptoolkit map and style them by cluster size using GeoJSON clustering.
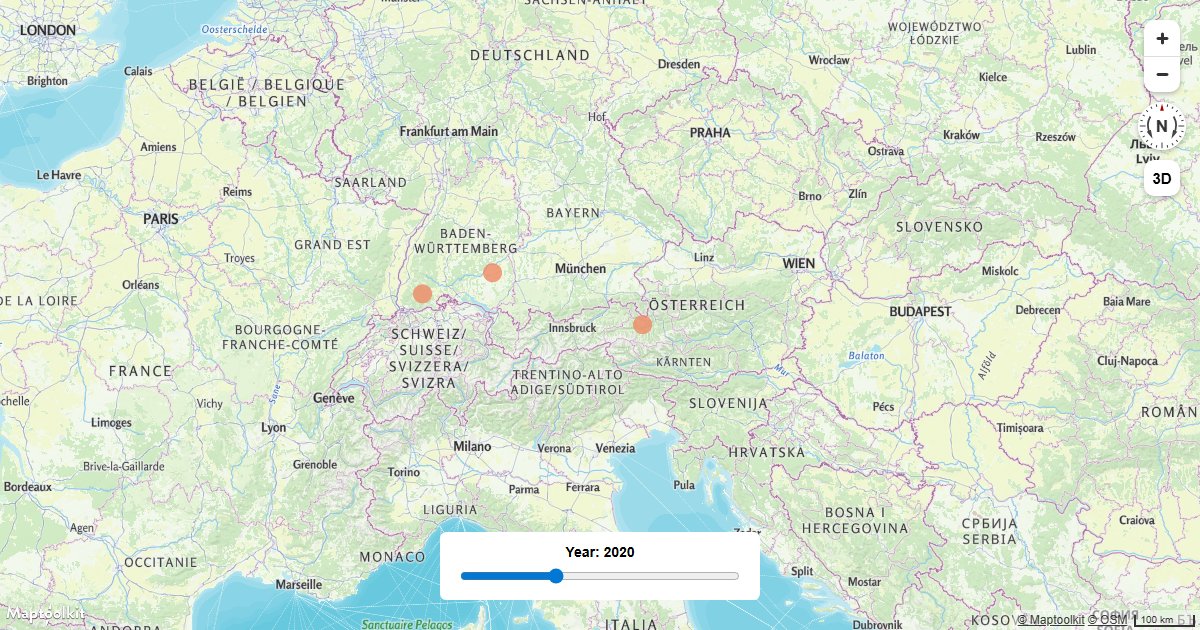
Create a Time Slider
Filter GeoJSON features on a Maptoolkit map by a time value using an HTML range slider and a filter expression.
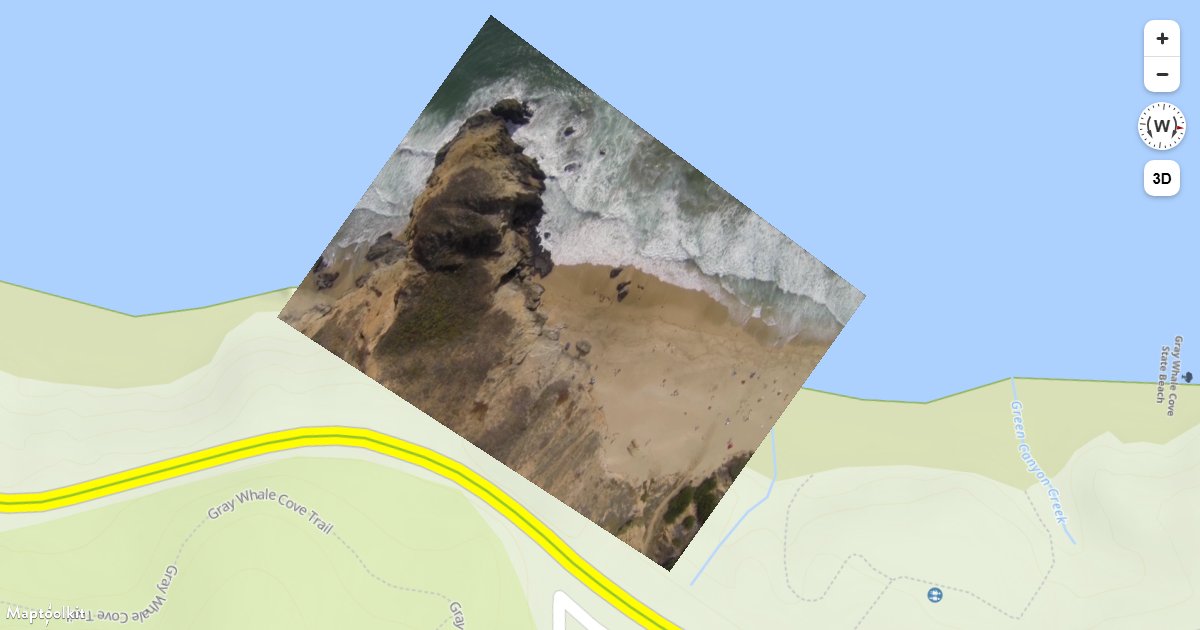
Add a Video
Overlay a video file at geographic bounds on a Maptoolkit map, with click-to-pause support.

Display a Non-Interactive Map
Render a fully static, non-interactive Maptoolkit map by disabling all user input handlers.
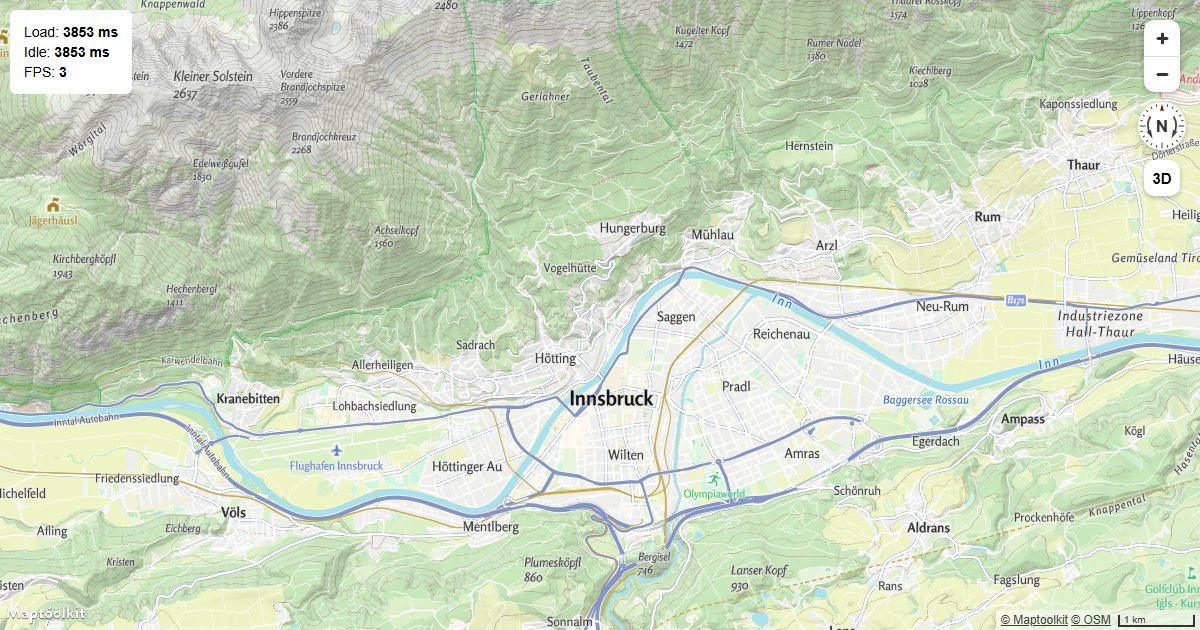
Display Map Performance Metrics
Measure Maptoolkit map load time, time to idle, and frames per second using built-in performance events.